This hexagon diagram sample was redesigned from the Wikipedia file: Virtuous circle in macroeconomics.svg. "An example of the use of a virtuous circle in macroeconomics."
[en.wikipedia.org/ wiki/ File:Virtuous_ circle_ in_ macroeconomics.svg]
"A virtuous circle and a vicious circle (also referred to as virtuous cycle and vicious cycle) are economic terms. They refer to a complex chain of events that reinforces itself through a feedback loop. A virtuous circle has favorable results, while a vicious circle has detrimental results.
Both circles are complexes of events with no tendency towards equilibrium (at least in the short run). Both systems of events have feedback loops in which each iteration of the cycle reinforces the previous one (positive feedback). These cycles will continue in the direction of their momentum until an external factor intervenes and breaks the cycle. The prefix "hyper-" is sometimes used to describe these cycles if they are extreme. The best-known example of a vicious circle is hyperinflation. ...
Example in macroeconomics.
Virtuous circle.
Economic growth can be seen as a virtuous circle. It might start with an exogenous factor such as technological innovation. As people get familiar with the new technology, there could be learning curve effects and economies of scale. This could lead to reduced costs and improved production efficiencies. In a competitive market structure, this will probably result in lower average prices or a decrease in employment as it takes fewer workers to produce the same output. As prices decrease, consumption could increase and aggregate output also. Increased levels of output lead to more learning and scale effects and a new cycle starts."
[en.wikipedia.org/ wiki/ Virtuous_ circle_ and_ vicious_ circle]
The crystal diagram example "Virtuous circle (macroeconomics)" was created using the ConceptDraw PRO diagramming and vector drawing software extended with the Target and Circular Diagrams solution from the Marketing area of ConceptDraw Solution Park.
www.conceptdraw.com/ solution-park/ marketing-target-and-circular-diagrams
Hexagon diagram
---crystal-diagram.png--diagram-flowchart-example.png)
Six Markets Model Chart

The six markets model defines six markets that take the central place in the relationship marketing: internal markets, supplier markets, recruitment markets, referral markets, influence markets and customer markets. The six markets model allows the organization to analyze the stakeholders and key market domains that can be important to it.
Competitor Analysis

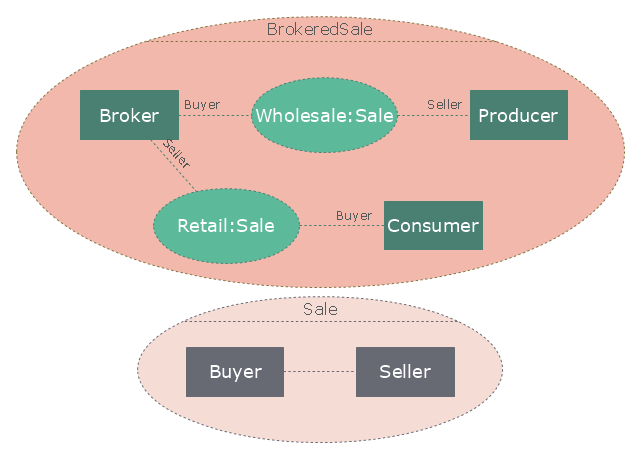
"A broker is an individual or party (brokerage firm) that arranges transactions between a buyer and a seller for a commission when the deal is executed. A broker who also acts as a seller or as a buyer becomes a principal party to the deal. Distinguish agent - one who acts on behalf of a principal. ...
In general a broker is an independent agent used extensively in some industries. A broker's prime responsibility is to bring sellers and buyers together and thus a broker is the third-person facilitator between a buyer and a seller. An example would be a real estate broker who facilitates the sale of a property.
Brokers also can furnish market information regarding prices, products, and market conditions. Brokers may represent either the seller (90% of the time) or the buyer (10%) but not both at the same time. An example would be a stockbroker, who makes the sale or purchase of securities on behalf of his client. Brokers play a huge role in the sale of stocks, bonds, and other financial services." [Broker. Wikipedia]
The UML composite structure diagram example "Sale process" was created using the ConceptDraw PRO diagramming and vector drawing software extended with the Rapid UML solution from the Software Development area of ConceptDraw Solution Park.
UML composite structure diagram
Process Flowchart


Circle Spoke Diagram Template

Marketing and Sales Organization chart. Organization chart Example

This sample shows the Organizational Chart that displays the Sales and marketing (CRM) module. Using the ready-to-use predesigned objects, samples and templates from the Organizational Charts Solution for ConceptDraw PRO you can create your own orgchart professional quick and easy.
Business diagrams & Org Charts with ConceptDraw PRO


Pyramid Charts

A Pyramid Chart has the form of triangle and hierarchically structures, organizes and help to analyze the information, data or ideas. Triangle is divided on the sections that usually have different widths. The width indicates the level of hierarchy among the topics.
 Circle-Spoke Diagrams
Examples of subject areas that are well suited to this approach are marketing, business, products promotion, process modeling, market, resource, time, and cost analysis. Circle-Spoke Diagrams are successfully used in presentations, conferences, management documents, magazines, reportages, reviews, reports, TV, and social media.
Pyramid Diagram

Polar Graph

Pyramid Diagram

Hiring Process

ConceptDraw PRO diagramming and vector drawing software aspires to help its users in the hiring process and offers a powerful HR Flowcharts Solution from the Management Area of ConceptDraw Solution Park.
- Market Structure Blocked Diagram
- Flowchart Of Market Structure
- Flow Chart Of Market Structure
- Flowchart Marketing Process. Flowchart Examples | Six Markets ...
- Circle-spoke diagram - Target market | Target and Circular ...
- Circle-spoke diagram - Target market | Target and Circular ...
- Diagram Of Marketing Organizational Structure
- Flowchart Marketing Process. Flowchart Examples | Process ...
- Circle-spoke diagram - Target market | Process Flowchart | Event ...
- The Circle Of Market Concepts
- Marketing Diagrams | Marketing Charts | Marketing Organization ...
- Ansoff Matrix | Matrices | Pyramid Diagram and Pyramid Chart ...
- Marketing Diagrams | Marketing | Six Markets Model Chart | Marketing
- Porter's value chain matrix diagram
- Block diagram - Six markets model
- Root cause analysis tree diagram - Sale problem solution | UML ...
- How To Create an Involvement Matrix | Matrix Organization Structure ...
- Six Markets Model Chart | Process Flowchart | Block diagram - Six ...
- Bubble diagram - Employment policy direction | Best Diagramming ...
- Basic Flowchart Examples | Hiring Process | Six Markets Model ...
- ERD | Entity Relationship Diagrams, ERD Software for Mac and Win
- Flowchart | Basic Flowchart Symbols and Meaning
- Flowchart | Flowchart Design - Symbols, Shapes, Stencils and Icons
- Flowchart | Flow Chart Symbols
- Electrical | Electrical Drawing - Wiring and Circuits Schematics
- Flowchart | Common Flowchart Symbols
- Flowchart | Common Flowchart Symbols