This circle-spoke diagram sample illustrates the target market concept.
"A target market is a group of customers towards which a business has decided to aim its marketing efforts and ultimately its merchandise. A well-defined target market is the first element to a marketing strategy. The marketing mix variables of product, place (distribution), promotion and price are the four elements of a marketing mix strategy that determine the success of a product in the marketplace." [Target market. Wikipedia]
The hub-and-spoke diagram example "Target market" was created using the ConceptDraw PRO diagramming and vector drawing software extended with the Circle-Spoke Diagrams solution from the area "What is a Diagram" of ConceptDraw Solution Park.
Circle-spoke diagram

 Target and Circular Diagrams
This solution extends ConceptDraw DIAGRAM software with samples, templates and library of design elements for drawing the Target and Circular Diagrams.
This circle-spoke diagram sample illustrates the target market concept.
"A target market is a group of customers towards which a business has decided to aim its marketing efforts and ultimately its merchandise. A well-defined target market is the first element to a marketing strategy. The marketing mix variables of product, place (distribution), promotion and price are the four elements of a marketing mix strategy that determine the success of a product in the marketplace." [Target market. Wikipedia]
The hub-and-spoke diagram example "Target market" was created using the ConceptDraw PRO diagramming and vector drawing software extended with the Circle-Spoke Diagrams solution from the area "What is a Diagram" of ConceptDraw Solution Park.
"A target market is a group of customers towards which a business has decided to aim its marketing efforts and ultimately its merchandise. A well-defined target market is the first element to a marketing strategy. The marketing mix variables of product, place (distribution), promotion and price are the four elements of a marketing mix strategy that determine the success of a product in the marketplace." [Target market. Wikipedia]
The hub-and-spoke diagram example "Target market" was created using the ConceptDraw PRO diagramming and vector drawing software extended with the Circle-Spoke Diagrams solution from the area "What is a Diagram" of ConceptDraw Solution Park.
Circle-spoke diagram
"A target market is a group of customers that the business has decided to aim its marketing efforts and ultimately its merchandise towards. A well-defined target market is the first element to a marketing strategy. The marketing mix variables of product, place (distribution), promotion and price are the four elements of a marketing mix strategy that determine the success of a product in the marketplace." [Target market. Wikipedia]
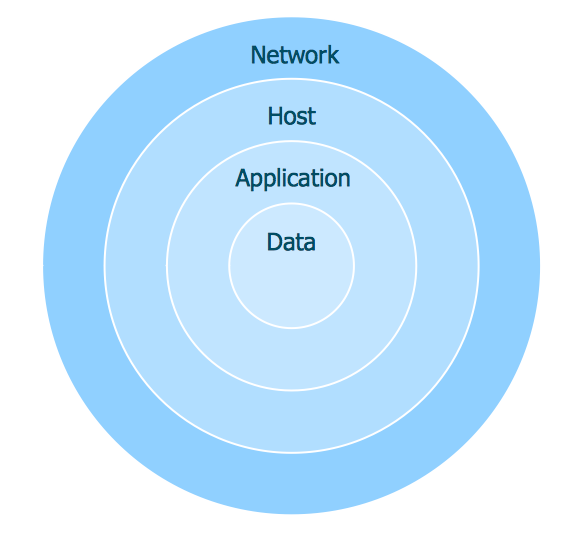
"An onion diagram is a kind of chart that shows the dependencies among parts of an organization or process. The chart displays items in concentric circles, where the items in each ring depend on the items in the smaller rings. ...
The Onion Diagram is able to show layers of a complete system in a few circles. Each of the circles is able to represent a component that is dependent upon the component on the inside of it shown by the circle inside of it. The main concept of the diagram is shown by the center circle of the diagram. This chart is used due to the fact that it has a clear visual representation that is easy to read, and it has a strong visual impact." [Onion diagram. Wikipedia]
This onion diagram (target diagram) example "Target market" was created using the ConceptDraw PRO diagramming and vector drawing software extended with the Target and Circular Diagrams solution from the Marketing area of ConceptDraw Solution Park.
www.conceptdraw.com/ solution-park/ marketing-target-and-circular-diagrams
Onion diagram

The vector stencils library "Target diagrams" contains 13 templates of target diagrams: marketing mix diagram, principles of marketing diagram, circle diagram, macro-micro environment diagram, stakeholder diagram, target market scope diagram.
Use these shapes to illustrate your marketing and sales documents, presentations, webpages and infographics in the ConceptDraw PRO diagramming and vector drawing software extended with the Target and Circular Diagrams solution from the Marketing area of ConceptDraw Solution Park.
www.conceptdraw.com/ solution-park/ marketing-target-and-circular-diagrams
Principles of marketing by Ph. Kotler

Marketing mix

Target

Principles of marketing by Ph. Kotler (prompt)
-target-diagrams---vector-stencils-library.png--diagram-flowchart-example.png)
Circle diagram

Macro-micro environmental forces diagram

Macro-micro environmental forces diagram (prompt)
-target-diagrams---vector-stencils-library.png--diagram-flowchart-example.png)
Stakeholder diagram

Target market scope diagram

Target diagram 1

Target diagram 2

Target diagram 3

Target diagram

The vector stencils library "Target diagrams" contains 13 templates of target diagrams: marketing mix diagram, principles of marketing diagram, circle diagram, macro-micro environment diagram, stakeholder diagram, target market scope diagram.
Use these shapes to illustrate your marketing and sales documents, presentations, webpages and infographics in the ConceptDraw PRO diagramming and vector drawing software extended with the Target and Circular Diagrams solution from the Marketing area of ConceptDraw Solution Park.
www.conceptdraw.com/ solution-park/ marketing-target-and-circular-diagrams
Use these shapes to illustrate your marketing and sales documents, presentations, webpages and infographics in the ConceptDraw PRO diagramming and vector drawing software extended with the Target and Circular Diagrams solution from the Marketing area of ConceptDraw Solution Park.
www.conceptdraw.com/ solution-park/ marketing-target-and-circular-diagrams
Principles of marketing by Ph. Kotler
Marketing mix
Target
Principles of marketing by Ph. Kotler (prompt)
Circle diagram
Macro-micro environmental forces diagram
Macro-micro environmental forces diagram (prompt)
Stakeholder diagram
Target market scope diagram
Target diagram 1
Target diagram 2
Target diagram 3
Target diagram
 Marketing
This solution extends ConceptDraw DIAGRAM and ConceptDraw MINDMAP with Marketing Diagrams and Mind Maps (brainstorming, preparing and holding meetings and presentations, sales calls).
Circle Spoke Diagram Template

 Circle-Spoke Diagrams
Examples of subject areas that are well suited to this approach are marketing, business, products promotion, process modeling, market, resource, time, and cost analysis. Circle-Spoke Diagrams are successfully used in presentations, conferences, management documents, magazines, reportages, reviews, reports, TV, and social media.
Relative Circular Diagram
This circular diagram sample was created on the base of the figure from the Florence-Darlington Technical College website. [bus.fdtc.edu/ sbed/ core/ core7.html]
"A marketing plan may be part of an overall business plan. Solid marketing strategy is the foundation of a well-written marketing plan. While a marketing plan contains a list of actions, a marketing plan without a sound strategic foundation is of little use. ...
A marketing plan for a small business typically includes Small Business Administration Description of competitors, including the level of demand for the product or service and the strengths and weaknesses of competitors:
(1) Description of the product or service, including special features.
(2) Marketing budget, including the advertising and promotional plan.
(3) Description of the business location, including advantages and disadvantages for marketing.
(4) Pricing strategy.
(5) Market Segmentation." [Marketing plan. Wikipedia]
The circular diagram example "Marketing plan" was created using the ConceptDraw PRO diagramming and vector drawing software extended with the Target and Circular Diagrams solution from the Marketing area of ConceptDraw Solution Park.
www.conceptdraw.com/ solution-park/ marketing-target-and-circular-diagrams
Circular diagram

Bar Diagrams for Problem Solving. Create event management bar charts with Bar Graphs Solution

Marketing Analysis Diagram

 Marketing Area
The solutions from Marketing area of ConceptDraw Solution Park collect templates, samples and libraries of vector stencils for drawing the marketing diagrams and mind maps.
Business diagrams & Org Charts with ConceptDraw DIAGRAM


This hexagon diagram sample was redesigned from the Wikipedia file: Virtuous circle in macroeconomics.svg. "An example of the use of a virtuous circle in macroeconomics."
[en.wikipedia.org/ wiki/ File:Virtuous_ circle_ in_ macroeconomics.svg]
"A virtuous circle and a vicious circle (also referred to as virtuous cycle and vicious cycle) are economic terms. They refer to a complex chain of events that reinforces itself through a feedback loop. A virtuous circle has favorable results, while a vicious circle has detrimental results.
Both circles are complexes of events with no tendency towards equilibrium (at least in the short run). Both systems of events have feedback loops in which each iteration of the cycle reinforces the previous one (positive feedback). These cycles will continue in the direction of their momentum until an external factor intervenes and breaks the cycle. The prefix "hyper-" is sometimes used to describe these cycles if they are extreme. The best-known example of a vicious circle is hyperinflation. ...
Example in macroeconomics.
Virtuous circle.
Economic growth can be seen as a virtuous circle. It might start with an exogenous factor such as technological innovation. As people get familiar with the new technology, there could be learning curve effects and economies of scale. This could lead to reduced costs and improved production efficiencies. In a competitive market structure, this will probably result in lower average prices or a decrease in employment as it takes fewer workers to produce the same output. As prices decrease, consumption could increase and aggregate output also. Increased levels of output lead to more learning and scale effects and a new cycle starts."
[en.wikipedia.org/ wiki/ Virtuous_ circle_ and_ vicious_ circle]
The crystal diagram example "Virtuous circle (macroeconomics)" was created using the ConceptDraw PRO diagramming and vector drawing software extended with the Target and Circular Diagrams solution from the Marketing area of ConceptDraw Solution Park.
www.conceptdraw.com/ solution-park/ marketing-target-and-circular-diagrams
Hexagon diagram
---crystal-diagram.png--diagram-flowchart-example.png)
 Marketing Diagrams
Marketing Diagrams solution extends ConceptDraw DIAGRAM diagramming software with abundance of samples, templates and vector design elements intended for easy graphical visualization and drawing different types of Marketing diagrams and graphs, including Branding Strategies Diagram, Five Forces Model Diagram, Decision Tree Diagram, Puzzle Diagram, Step Diagram, Process Chart, Strategy Map, Funnel Diagram, Value Chain Diagram, Ladder of Customer Loyalty Diagram, Leaky Bucket Diagram, Promotional Mix Diagram, Service-Goods Continuum Diagram, Six Markets Model Diagram, Sources of Customer Satisfaction Diagram, etc. Analyze effectively the marketing activity of your company and apply the optimal marketing methods with ConceptDraw DIAGRAM software.
 ConceptDraw Solution Park
ConceptDraw Solution Park collects graphic extensions, examples and learning materials
Six Markets Model Chart

Six Markets Model Chart Template

- Target and Circular Diagrams | Target market - Onion diagram ...
- Marketing mix - Wheel diagram | Target market - Onion diagram ...
- Circle-spoke diagram template - Target market | Pie Chart Examples ...
- Target market - Onion diagram | Foreign trade - Onion diagram ...
- Target and Circular Diagrams | Business diagrams & Org Charts ...
- Marketing | Circle-spoke diagram template - Target market ...
- Marketing | Target market - Onion diagram | Target and Circular ...
- Target market - Onion diagram | Circle-spoke diagram - Target ...
- Circle-spoke diagram template - Target market | Marketing | Target ...
- Circle-spoke diagram template - Target market | Circle-Spoke ...
- Value pyramid - Marketing diagram | Circle-spoke diagram template ...
- Arrow circle chart template | Circle-spoke diagram template - Target ...
- Circle-Spoke Diagrams | Circle-spoke diagram template - Target ...
- Target market - Onion diagram | Market value - Pyramid diagram ...
- Circle-spoke diagram - Proximity based marketing | Circle-spoke ...
- Target diagram template
- Marketing Diagrams | Pyramid Chart Examples | Circle-spoke ...
- Circle-spoke diagram - Target market
- Circle-spoke diagram template - Target market | How to Draw a ...
- Circle-spoke diagram template - Target market | Arrow circle chart ...