Cause and Effect Diagram Software

You can design your Cause and Effect diagram on a paper, but more effective way is to use specific software - ConceptDraw DIAGRAM is a powerful Cause and Effect Diagram Software. It helps you create Cause and Effect diagram known also as Fishbone diagram or Ishikawa diagram from templates and examples.
Cause and Effect Diagrams

ConceptDraw DIAGRAM powerful diagramming and vector drawing software provides the Fishbone Diagrams solution from the Management area of ConceptDraw Solution Park that allows to design the Cause and Effect Diagrams quick, easy and effective.
Cause and Effect Analysis


Cause and Effect Diagram

Root Cause Analysis

Analyze the root causes for factors that influenced the problem. This diagram is constructed separately for each highly prioritized factor. The goal of this is to find the root causes for the factor and list possible corrective action.
Cause and Effect Fishbone Diagram

Now the problem of complexity the Cause and Effect Fishbone Diagram creating is solved thanks to the ConceptDraw DIAGRAM diagramming and vector drawing software extended with Fishbone Diagrams solution from the Management area.
PROBLEM ANALYSIS. Root Cause Analysis Tree Diagram

ConceptDraw Office suite is a software for problem analysis.
HelpDesk
How To Create Root Cause Analysis Diagram Using Solutions

Cause and Effect Analysis - Fishbone Diagrams for Problem Solving

Cause and Effect Analysis

Root Cause Tree Diagram

Identify the root causes for a factor and then list possible corrective action.
The diagram displays the structure of causes for a factor and possible corrective actions.
The Root Cause Tree Diagram is used for further formulation of actions.
"Root cause analysis (RCA) is a method of problem solving that tries to identify the root causes of faults or problems.
RCA practice tries to solve problems by attempting to identify and correct the root causes of events, as opposed to simply addressing their symptoms. Focusing correction on root causes has the goal of preventing problem recurrence. RCFA (Root Cause Failure Analysis) recognizes that complete prevention of recurrence by one corrective action is not always possible.
Conversely, there may be several effective measures (methods) that address the root causes of a problem. Thus, RCA is an iterative process and a tool of continuous improvement.
RCA is typically used as a reactive method of identifying event(s) causes, revealing problems and solving them. Analysis is done after an event has occurred. Insights in RCA may make it useful as a preemptive method. In that event, RCA can be used to forecast or predict probable events even before they occur. While one follows the other, RCA is a completely separate process to Incident Management." [Root cause analysis. Wikipedia]
The root cause analysis (RCA) tree diagram example "Manufacturing problem solution" was created using the ConceptDraw PRO diagramming and vector drawing software extended with the solution "Seven Management and Planning Tools" from the Management area of ConceptDraw Solution Park.
Tree diagram

"Ishikawa diagrams (also called fishbone diagrams, herringbone diagrams, cause-and-effect diagrams, or Fishikawa) are causal diagrams created by Kaoru Ishikawa (1968) that show the causes of a specific event. Common uses of the Ishikawa diagram are product design and quality defect prevention, to identify potential factors causing an overall effect. Each cause or reason for imperfection is a source of variation. Causes are usually grouped into major categories to identify these sources of variation. The categories typically include:
- People: Anyone involved with the process
- Methods: How the process is performed and the specific requirements for doing it, such as policies, procedures, rules, regulations and laws
- Machines: Any equipment, computers, tools, etc. required to accomplish the job
- Materials: Raw materials, parts, pens, paper, etc. used to produce the final product
- Measurements: Data generated from the process that are used to evaluate its quality
- Environment: The conditions, such as location, time, temperature, and culture in which the process operates" [Ishikawa diagram. Wikipedia]
The fishbone diagram example "Causes of low-quality output" was created using the ConceptDraw PRO diagramming and vector drawing software extended with the Fishbone Diagrams solution from the Management area of ConceptDraw Solution Park.
Ishikawa diagram

Problem solving

These tools are exemplary at organizing research, parsing complex problems, providing a structure for the details, helping managers make decisions, and organizing effective communications in a visual manner that keeps everyone involved.
PROBLEM ANALYSIS. Relations Diagram

ConceptDraw OFFICE suite is a software for relation diagram making.
"Root cause analysis (RCA) is a method of problem solving that tries to identify the root causes of faults or problems. ...
RCA (in steps 3, 4 and 5) forms the most critical part of successful corrective action, because it directs the corrective action at the true root cause of the problem. Knowing the root cause is secondary to the goal of prevention, but without knowing the root cause, it is not possible to determine what an effective corrective action for the defined problem would be. ...
3. Ask "why" and identify the causes associated with each step in the sequence towards the defined problem or event. "Why" is taken to mean "What were the factors that directly resulted in the effect?"
4. Classify causes into causal factors that relate to an event in the sequence and root causes, that if eliminated, can be agreed to have interrupted that step of the sequence chain.
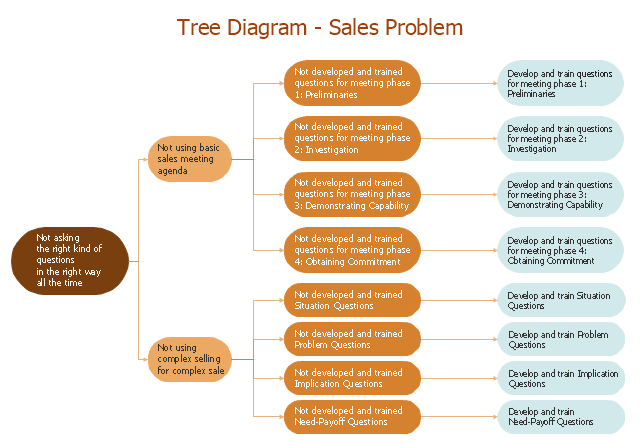
5. Identify all other harmful factors that have equal or better claim to be called "root causes." If there are multiple root causes, which is often the case, reveal those clearly for later optimum selection." [Root cause analysis. Wikipedia]
This root cause analysis (RCA) tree diagram example "Sale problem solution" was created using the ConceptDraw PRO diagramming and vector drawing software extended with the Seven Management and Planning Tools solution from the Management area of ConceptDraw Solution Park.
RCA (in steps 3, 4 and 5) forms the most critical part of successful corrective action, because it directs the corrective action at the true root cause of the problem. Knowing the root cause is secondary to the goal of prevention, but without knowing the root cause, it is not possible to determine what an effective corrective action for the defined problem would be. ...
3. Ask "why" and identify the causes associated with each step in the sequence towards the defined problem or event. "Why" is taken to mean "What were the factors that directly resulted in the effect?"
4. Classify causes into causal factors that relate to an event in the sequence and root causes, that if eliminated, can be agreed to have interrupted that step of the sequence chain.
5. Identify all other harmful factors that have equal or better claim to be called "root causes." If there are multiple root causes, which is often the case, reveal those clearly for later optimum selection." [Root cause analysis. Wikipedia]
This root cause analysis (RCA) tree diagram example "Sale problem solution" was created using the ConceptDraw PRO diagramming and vector drawing software extended with the Seven Management and Planning Tools solution from the Management area of ConceptDraw Solution Park.
RCA diagram
This cause and effect diagram sample was redesigned from the Wikimedia Commons file: Ursache Wirkung Diagramm Beispiel.png. [commons.wikimedia.org/ wiki/ File:Ursache_ Wirkung_ Diagramm_ Beispiel.png]
This file is licensed under the Creative Commons Attribution-Share Alike 3.0 Unported license. [creativecommons.org/ licenses/ by-sa/ 3.0/ deed.en]
"Productivity is the ratio of output to inputs in production; it is an average measure of the efficiency of production. Efficiency of production means production’s capability to create incomes which is measured by the formula real output value minus real input value.
Productivity is a crucial factor in production performance of firms and nations. Increasing national productivity can raise living standards because more real income improves people's ability to purchase goods and services, enjoy leisure, improve housing and education and contribute to social and environmental programs. Productivity growth also helps businesses to be more profitable." [Productivity. Wikipedia]
The fishbone diagram example "Increase in productivity" was created using the ConceptDraw PRO diagramming and vector drawing software extended with the Fishbone Diagrams solution from the Management area of ConceptDraw Solution Park.
Ishikawa diagram

How Do Fishbone Diagrams Solve Manufacturing Problems

ConceptDraw DIAGRAM application extended with Fishbone Diagrams solution lets you construct Fishbone diagrams and represent globally recognized standards for manufacturing 6 Ms and 8 Ms.
The vector stencils library "Cause-and-effect diagram" contains 13 elements of fishbone diagram.
Use it to design your Ishikawa diagrams with ConceptDraw PRO diagramming and vector drawing software.
"Ishikawa diagrams (also called fishbone diagrams, herringbone diagrams, cause-and-effect diagrams, or Fishikawa) are causal diagrams created by Kaoru Ishikawa (1968) that show the causes of a specific event. Common uses of the Ishikawa diagram are product design and quality defect prevention to identify potential factors causing an overall effect. Each cause or reason for imperfection is a source of variation. Causes are usually grouped into major categories to identify these sources of variation. ...
The basic concept was first used in the 1920s, and is considered one of the seven basic tools of quality control." [Ishikawa diagram. Wikipedia]
The example of fishbone diagram shapes "Design elements - Cause-and-effect diagram" is included in the Seven Basic Tools of Quality solution from the Quality area of ConceptDraw Solution Park.
Fishbone diagram elements

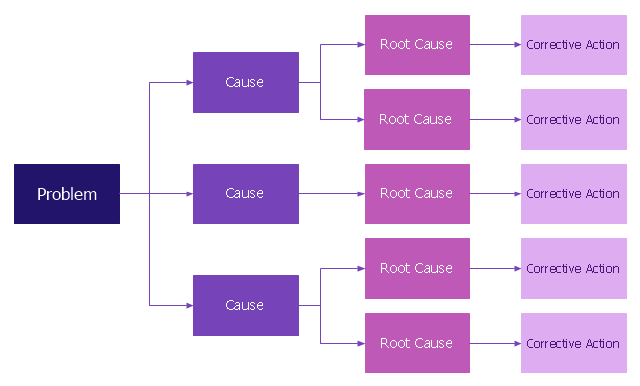
Root cause analysis (RCA) tree diagram lets identify the root causes for a factor and then list possible corrective action. The diagram displays the structure of causes for a factor and possible corrective actions. The root cause analysis tree diagram is used for further formulation of actions.
"Tree Diagram.
This tool is used to break down broad categories into finer and finer levels of detail. It can map levels of details of tasks that are required to accomplish a goal or solution or task. Developing the tree diagram helps one move their thinking from generalities to specifics." [Seven Management and Planning Tools. Wikipedia]
This root cause analysis tree diagram template for the ConceptDraw PRO diagramming and vector drawing software is included in the Seven Management and Planning Tools solution from the Management area of ConceptDraw Solution Park.
RCA diagram
- PROBLEM ANALYSIS. Root Cause Analysis Tree Diagram | Root ...
- PROBLEM ANALYSIS. Prioritization Matrix | Cause and Effect ...
- 4 Ms fishbone diagram - Production process | Manufacturing 8 Ms ...
- Fishbone Diagrams | Blank Calendar Template | Cause and Effect ...
- Fishbone diagram - Causes of low-quality output | Fishbone ...
- Fault Tree Analysis Diagrams | Root cause analysis tree diagram ...
- Root cause analysis tree diagram - Template | Fault Tree Analysis ...
- Ishikawa fishbone diagram | Fishbone diagram - Bad coffee | Cause ...
- Cause and Effect Diagrams | Cause and Effect Analysis - Fishbone ...
- Cause and Effect Analysis | Problem solving | Using Fishbone ...
- Cause and effect diagram - Increase in productivity | Fishbone ...
- PROBLEM ANALYSIS. Prioritization Matrix | Root Cause Analysis ...
- Root cause analysis tree diagram - Personal problem solution ...
- How To Create a MS Visio Cause and Effect Diagram Using ...
- Cause and Effect Analysis - Fishbone Diagrams for Problem Solving ...
- Fishbone Diagrams | Fishbone diagram - Causes of low-quality ...
- Cause and Effect Analysis | Root Cause Tree Diagram | Problem ...
- When To Use a Fishbone Diagram | Fishbone Diagram Template ...
- Root cause analysis tree diagram - Template | Fault Tree Diagram ...
- Cause and Effect Diagram | How Do Fishbone Diagrams Solve ...
- ERD | Entity Relationship Diagrams, ERD Software for Mac and Win
- Flowchart | Basic Flowchart Symbols and Meaning
- Flowchart | Flowchart Design - Symbols, Shapes, Stencils and Icons
- Flowchart | Flow Chart Symbols
- Electrical | Electrical Drawing - Wiring and Circuits Schematics
- Flowchart | Common Flowchart Symbols
- Flowchart | Common Flowchart Symbols