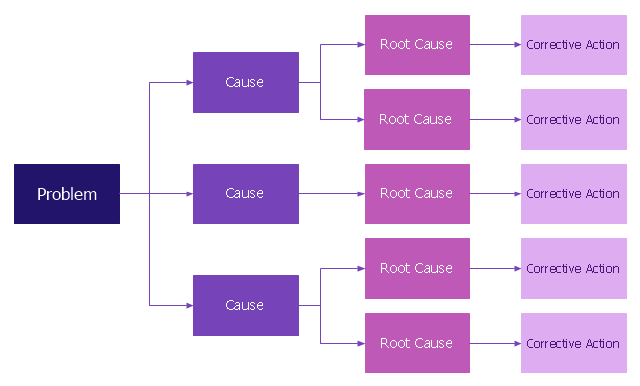
Root cause analysis (RCA) tree diagram lets identify the root causes for a factor and then list possible corrective action. The diagram displays the structure of causes for a factor and possible corrective actions. The root cause analysis tree diagram is used for further formulation of actions.
"Tree Diagram.
This tool is used to break down broad categories into finer and finer levels of detail. It can map levels of details of tasks that are required to accomplish a goal or solution or task. Developing the tree diagram helps one move their thinking from generalities to specifics." [Seven Management and Planning Tools. Wikipedia]
This root cause analysis tree diagram template for the ConceptDraw PRO diagramming and vector drawing software is included in the Seven Management and Planning Tools solution from the Management area of ConceptDraw Solution Park.
RCA diagram
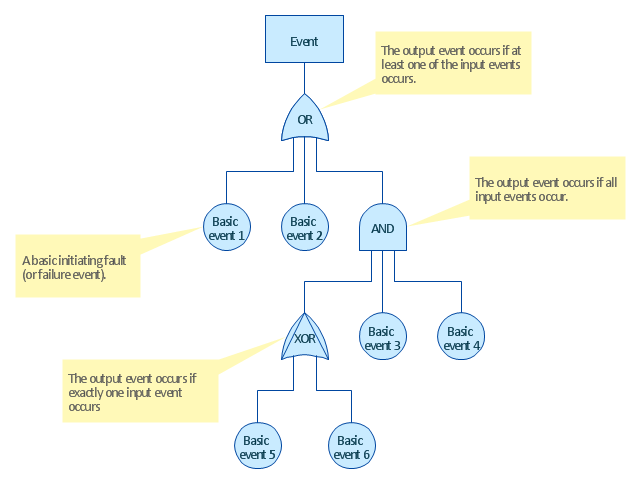
Fault Tree Diagram

HelpDesk
How to Create a Fault Tree Analysis Diagram (FTD)

Fault tree analysis diagrams solution extends ConceptDraw PRO software with templates, samples and library of vector stencils for drawing the FTA diagrams.
Fault Tree
Workflow
Cash Venn
Used Solutions
HelpDesk
How To Create Root Cause Analysis Diagram Using Solutions

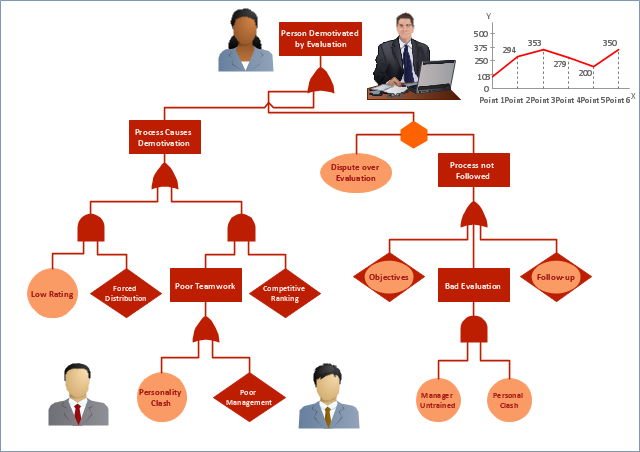
"Fault tree analysis (FTA) ... can be used to:
(1) understand the logic leading to the top event / undesired state.
(2) show compliance with the (input) system safety / reliability requirements.
(3) prioritize the contributors leading to the top event - Creating the Critical Equipment/ Parts/ Events lists for different importance measures.
(4) monitor and control the safety performance of the complex system (e.g., is a particular aircraft safe to fly when fuel valve x malfunctions? For how long is it allowed to fly with the valve malfunction?).
(5) minimize and optimize resources.
(6) assist in designing a system. The FTA can be used as a design tool that helps to create (output / lower level) requirements.
(7) function as a diagnostic tool to identify and correct causes of the top event. It can help with the creation of diagnostic manuals / processes." [Fault tree analysis. Wikipedia]
The fault tree analysis diagram template for the ConceptDraw PRO diagramming and vector drawing software is included in the Fault Tree Analysis Diagrams solution from the Engineering area of ConceptDraw Solution Park.
FTA diagram template
 Seven Management and Planning Tools
Seven Management and Planning Tools solution extends ConceptDraw DIAGRAM and ConceptDraw MINDMAP with features, templates, samples and libraries of vector stencils for drawing management mind maps and diagrams.
 Family Tree
Family Tree solution with included vector design shapes for drawing family trees, pedigree chart symbols, photo blocks of different detailing and professionally designed samples, extends the functionality of ConceptDraw DIAGRAM software making it the best family tree maker and easy-to-use ancestry trees designer program for researchers, scientists, historians, genetics, medics, archeologists, and other stakeholders. Use it to design informative and colorful genealogy trees, simple family tree or extensive ancestry tree of any depth, genealogy schematics and illustrations with family trees.
 Fault Tree Analysis Diagrams
This solution extends ConceptDraw DIAGRAM.5 or later with templates, fault tree analysis example, samples and a library of vector design elements for drawing FTA diagrams (or negative analytical trees), cause and effect diagrams and fault tree diagrams.
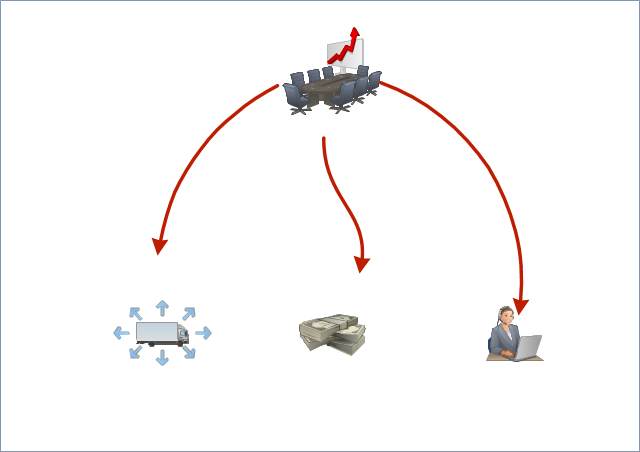
"Process Decision Program Chart (PDPC).
A useful way of planning is to break down tasks into a hierarchy, using a tree diagram. The PDPC extends the tree diagram a couple of levels to identify risks and countermeasures for the bottom level tasks. Different shaped boxes are used to highlight risks and identify possible countermeasures (often shown as 'clouds' to indicate their uncertain nature). The PDPC is similar to the Failure Modes and Effects Analysis (FMEA) in that both identify risks, consequences of failure, and contingency actions; the FMEA also rates relative risk levels for each potential failure point." [Seven Management and Planning Tools. Wikipedia]
The Risk diagram (process decision program chart, PDPC) determines the risks when corrective action is not performed correctly. Also, it helps develop descriptions for preventive actions at the level of execution.
The Risk diagram (PDPC) template for the ConceptDraw PRO diagramming and vector drawing software is included in the solution "Seven Management and Planning Tools" from the Management area of ConceptDraw Solution Park.
Risk diagram
---template.png--diagram-flowchart-example.png)
Cause and Effect Analysis


Fault Tree Analysis Example

HelpDesk
How to Create a DOM Tree Diagram

HelpDesk
How to Create a Class Hierarchy Tree Diagram

 Seven Management and Planning Tools
Seven Management and Planning Tools solution extends ConceptDraw DIAGRAM and ConceptDraw MINDMAP with features, templates, samples and libraries of vector stencils for drawing management mind maps and diagrams.
HelpDesk
How to Draw a Decision-Making Diagram

The Action Plan

 Active Directory Diagrams
Active Directory Diagrams solution significantly extends the capabilities of ConceptDraw DIAGRAM software with special Active Directory samples, convenient template and libraries of Active Directory vector stencils, common icons of sites and services, icons of LDPA elements, which were developed to help you in planning and modelling network structures and network topologies, in designing excellently looking Active Directory diagrams, Active Directory Structure diagrams, and Active Directory Services diagram, which are perfect way to visualize detailed structures of Microsoft Windows networks, Active Directory Domain topology, Active Directory Site topology, Organizational Units (OU), and Exchange Server organization.
 Total Quality Management TQM Diagrams
In order to make the TQM-related drawings, the Total Quality Management Diagrams solution is used extending the ConceptDraw DIAGRAM charting and drawing software with the pre-made samples, templates and a stencil library full of vector shapes. It can help any ConceptDraw DIAGRAM user to visualize both business and industrial processes in a way of making the TQM Diagrams. To demonstrate clearly a process step-by-step in a visual manner and to make the needed TQM Diagrams in order to compare both the ideal and the real stages of some process, is possible with the Total Quality Management Diagram solution.
PROBLEM ANALYSIS. Relations Diagram

- Root cause analysis tree diagram - Template | How To Create Root ...
- Fault tree analysis (FTA) diagram template | Fault Tree Diagram ...
- Decision tree diagram | Marketing Diagrams | MS Visio Look a Like ...
- Root cause analysis tree diagram - Template | New Year card ...
- Fault Tree Diagram | Tree Template For Visio
- Root cause analysis tree diagram - Template | Root cause analysis ...
- Fault Tree Analysis Diagrams | Tree Diagram Template For Mac
- Fault tree analysis diagram template
- Root cause analysis tree diagram - Template | How to Create SWOT ...