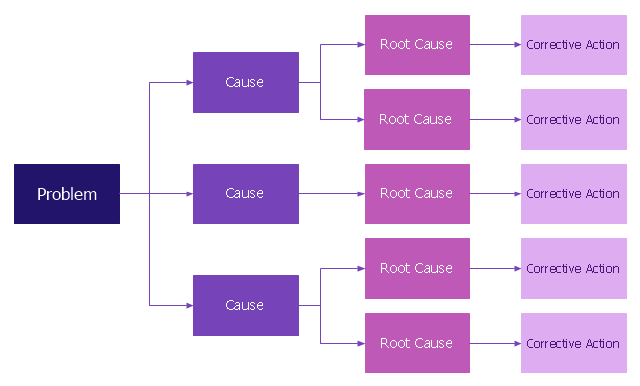
Root cause analysis (RCA) tree diagram lets identify the root causes for a factor and then list possible corrective action. The diagram displays the structure of causes for a factor and possible corrective actions. The root cause analysis tree diagram is used for further formulation of actions.
"Tree Diagram.
This tool is used to break down broad categories into finer and finer levels of detail. It can map levels of details of tasks that are required to accomplish a goal or solution or task. Developing the tree diagram helps one move their thinking from generalities to specifics." [Seven Management and Planning Tools. Wikipedia]
This root cause analysis tree diagram template for the ConceptDraw PRO diagramming and vector drawing software is included in the Seven Management and Planning Tools solution from the Management area of ConceptDraw Solution Park.
RCA diagram
The New Year card template "Christmas tree" for the ConceptDraw PRO diagramming and vector drawing software is included in the Holiday Solution from the Illustration area of ConceptDraw Solution Park.
Vector illustration

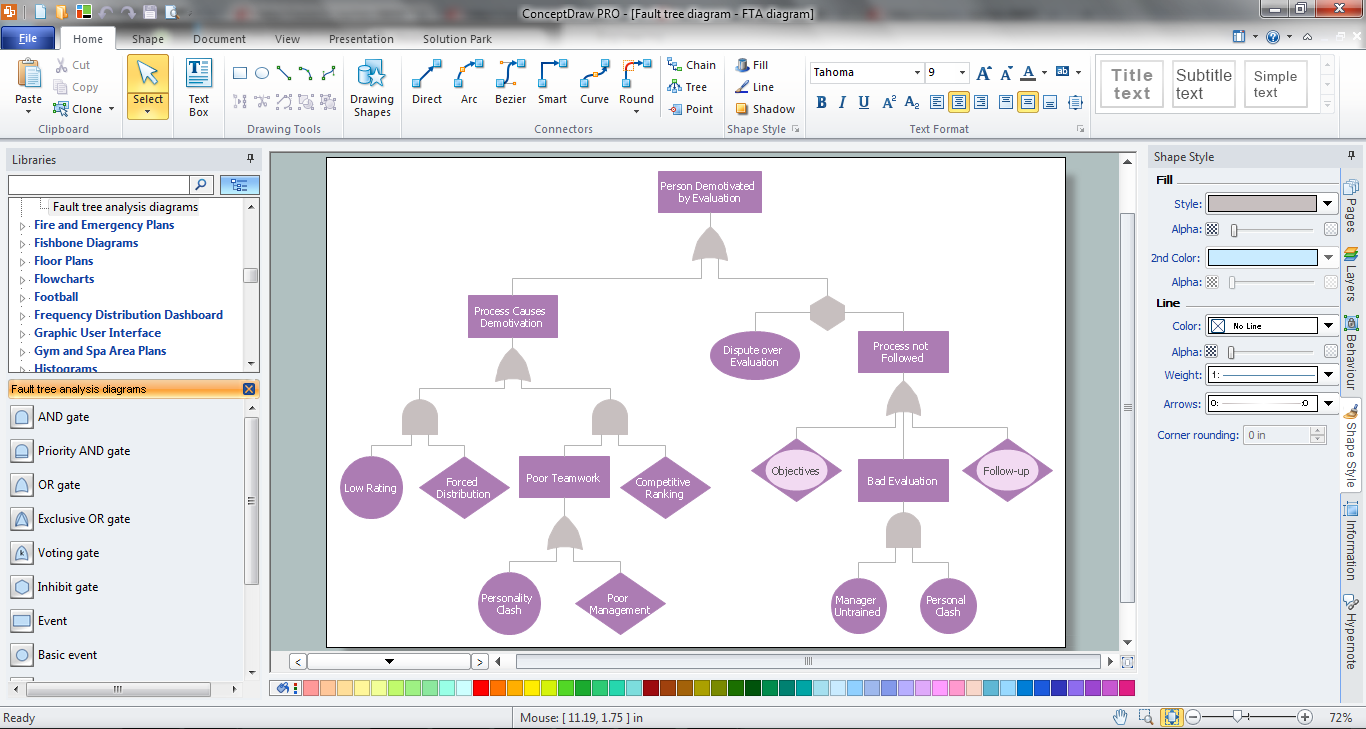
Fault Tree Analysis Example
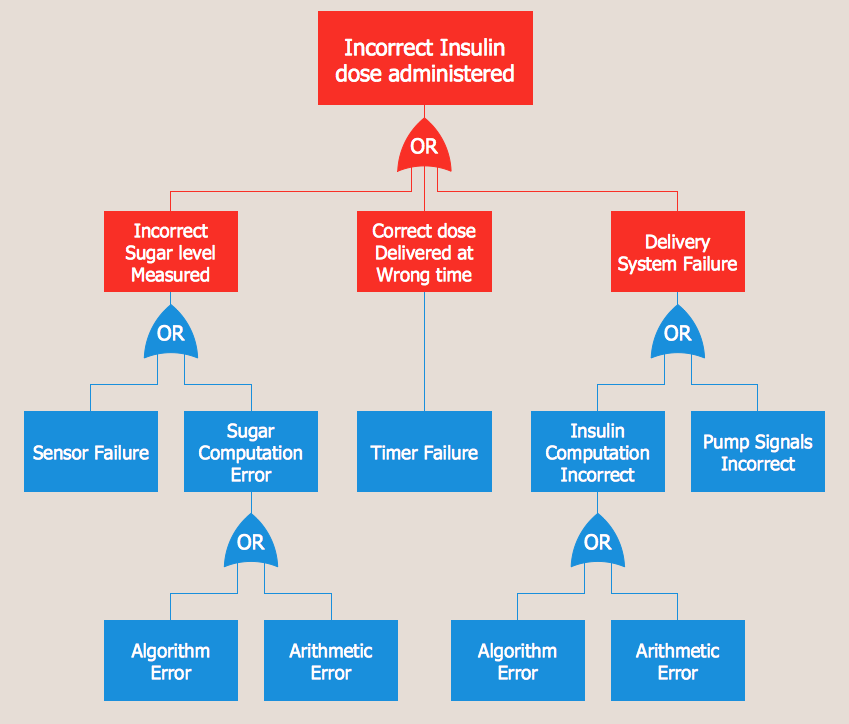
"Fault tree analysis (FTA) ... can be used to:
(1) understand the logic leading to the top event / undesired state.
(2) show compliance with the (input) system safety / reliability requirements.
(3) prioritize the contributors leading to the top event - Creating the Critical Equipment/ Parts/ Events lists for different importance measures.
(4) monitor and control the safety performance of the complex system (e.g., is a particular aircraft safe to fly when fuel valve x malfunctions? For how long is it allowed to fly with the valve malfunction?).
(5) minimize and optimize resources.
(6) assist in designing a system. The FTA can be used as a design tool that helps to create (output / lower level) requirements.
(7) function as a diagnostic tool to identify and correct causes of the top event. It can help with the creation of diagnostic manuals / processes." [Fault tree analysis. Wikipedia]
The fault tree analysis diagram template for the ConceptDraw PRO diagramming and vector drawing software is included in the Fault Tree Analysis Diagrams solution from the Engineering area of ConceptDraw Solution Park.
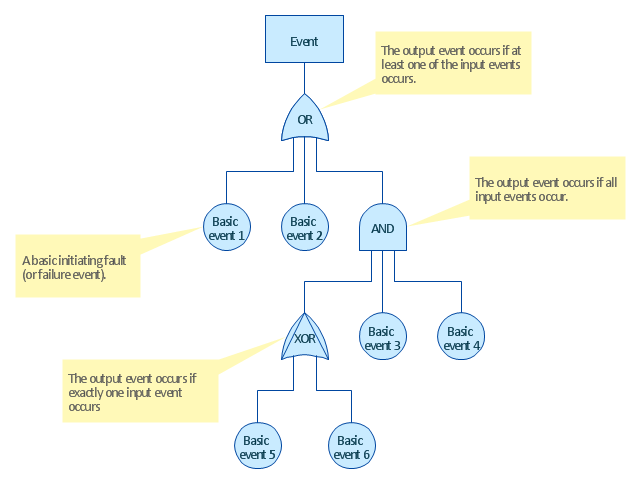
FTA diagram template
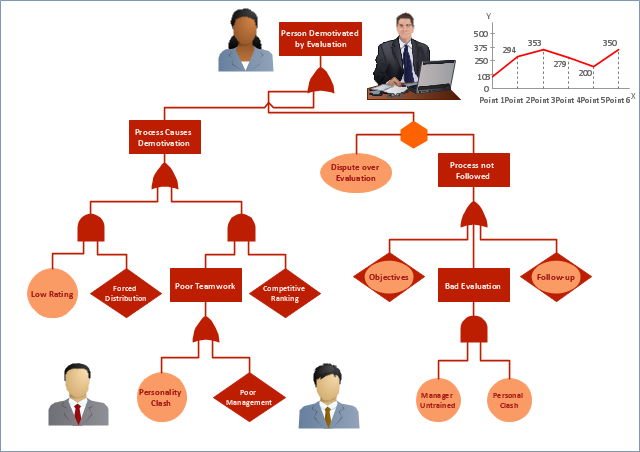
Cause and Effect Analysis


Cross-Functional Process Map Template

Fault tree analysis diagrams solution extends ConceptDraw PRO software with templates, samples and library of vector stencils for drawing the FTA diagrams.
Fault Tree
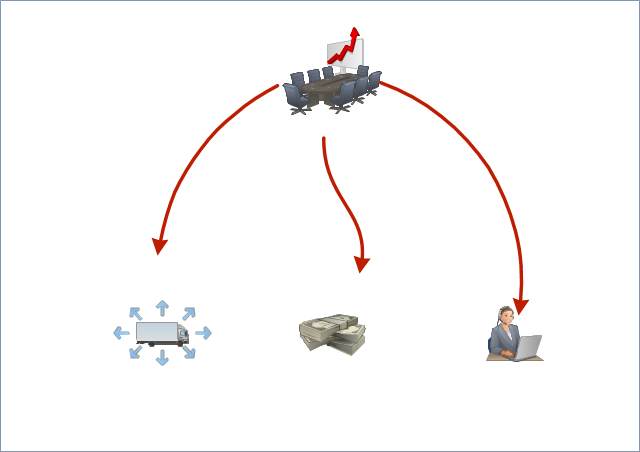
Workflow
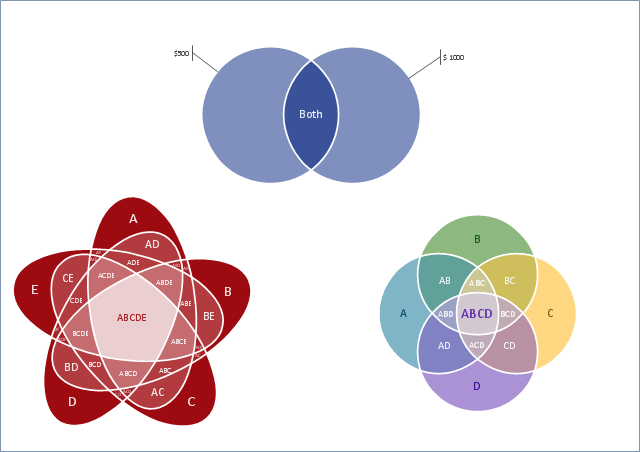
Cash Venn
Used Solutions
Fault Tree Diagram

 Fault Tree Analysis Diagrams
This solution extends ConceptDraw DIAGRAM.5 or later with templates, fault tree analysis example, samples and a library of vector design elements for drawing FTA diagrams (or negative analytical trees), cause and effect diagrams and fault tree diagrams.
Context Diagram Template

This template shows the Context Diagram. It was created in ConceptDraw DIAGRAM diagramming and vector drawing software using the Block Diagrams Solution from the “Diagrams” area of ConceptDraw Solution Park. The context diagram graphically identifies the system. external factors, and relations between them. It’s a high level view of the system. The context diagrams are widely used in software engineering and systems engineering for designing the systems that process the information.
Flowchart Examples and Templates

Fault Tree Analysis Software
HelpDesk
How To Create Root Cause Analysis Diagram Using Solutions

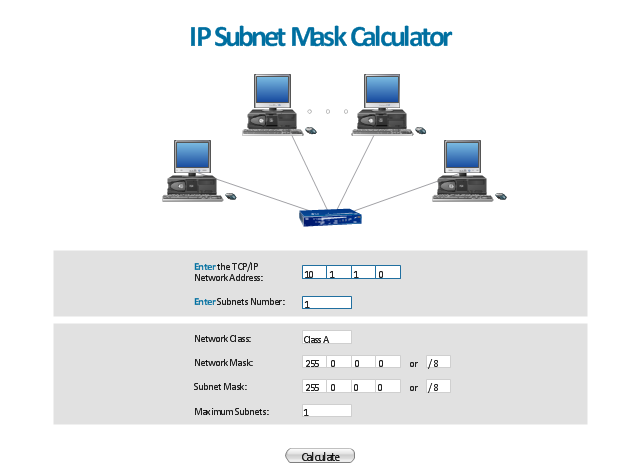
"A subnetwork, or subnet, is a logically visible subdivision of an IP network. The practice of dividing a network into two or more networks is called subnetting.
All computers that belong to a subnet are addressed with a common, identical, most-significant bit-group in their IP address. This results in the logical division of an IP address into two fields, a network or routing prefix and the rest field or host identifier. The rest field is an identifier for a specific host or network interface.
The routing prefix is expressed in CIDR notation. It is written as the first address of a network, followed by a slash character (/ ), and ending with the bit-length of the prefix. ...
The IPv6 address specification 2001:db8::/ 32 is a large address block with 296 addresses, having a 32-bit routing prefix. In IPv4 the routing prefix is also specified in the form of the subnet mask, which is expressed in quad-dotted decimal representation like an address. ...
Traffic between subnetworks is exchanged or routed with special gateways called routers which constitute the logical or physical boundaries between the subnets.
The benefits of subnetting vary with each deployment scenario. In the address allocation architecture of the Internet using Classless Inter-Domain Routing (CIDR) and in large organizations, it is necessary to allocate address space efficiently. It may also enhance routing efficiency, or have advantages in network management when subnetworks are administratively controlled by different entities in a larger organization. Subnets may be arranged logically in a hierarchical architecture, partitioning an organization's network address space into a tree-like routing structure." [Subnetwork. Wikipedia]
The template "IP Subnet mask calculator" for the ConceptDraw PRO diagramming and vector drawing software is included in the Computer and Networks solution from the Computer and Networks area of ConceptDraw Solution Park.
HelpDesk
How to Create a Fault Tree Analysis Diagram (FTD)

- Root cause analysis tree diagram - Template | Fault Tree Analysis ...
- Root cause analysis tree diagram - Template
- Problem Solution Tree Templates
- Ivr Tree Template
- Free Corporate Tree Template
- Fault Tree Analysis Software | Fire Evacuation Plan Template ...
- Sample Decision Tree Template
- Decision Tree Template Visio
- Workflow Diagram | The Why Tree Root Cause Analysis Reusable ...
- Fault Tree Analysis Diagrams | Context Diagram Template | Root ...
- Taproot Root Cause Tree Template
- Free Problem Tree Template
- Fault Tree Analysis Template
- Fault Tree Analysis Excel Template
- Pyramid Diagram | Context Diagram Template | Org Chart Diagram ...
- How To Draw Fault Tree In Word
- Problem Tree Template Word
- Root cause analysis tree diagram - Template | How To Create Root ...
- Christmas card Santa's sleigh - Template | New Year card Christmas ...
- Problem Tree Template