Draw Company Structure with Organization Charting Software
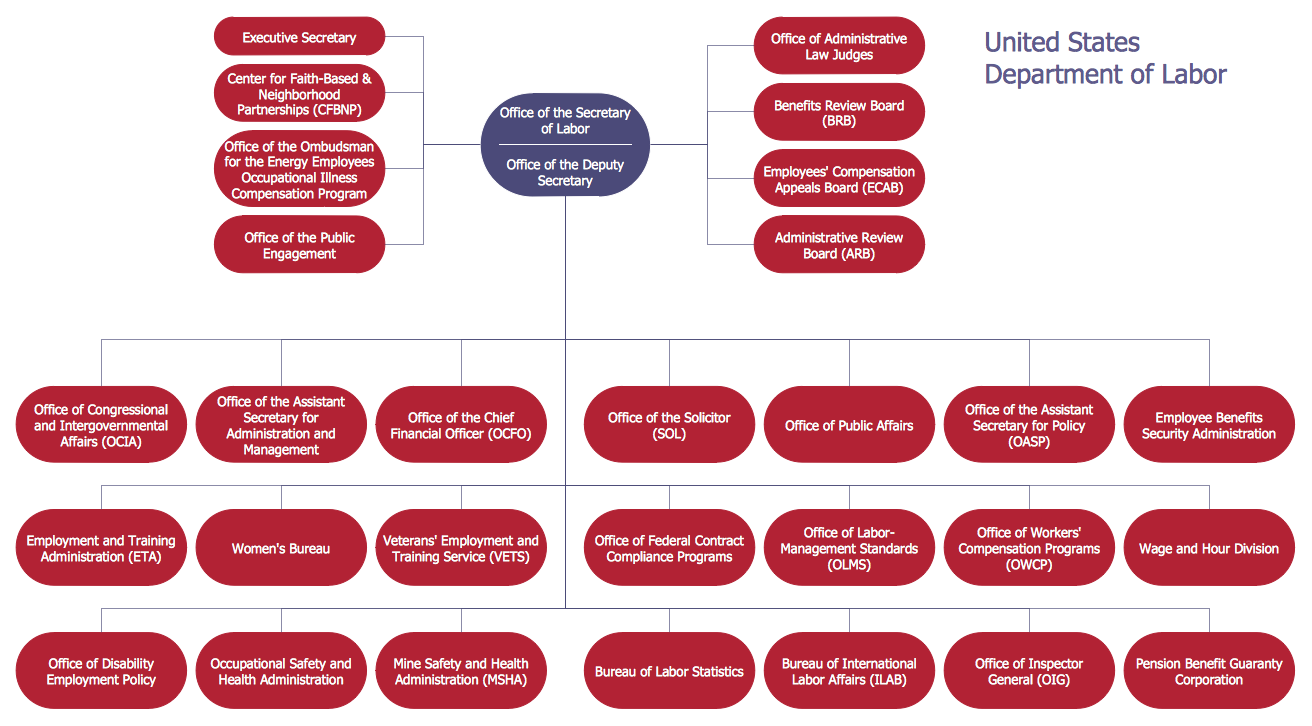
Company Structure Diagram gives the detailed information about the company structure and hierarchy - who execute what tasks and who is in charge at this company. This information shows the reasoning and success of business and is indispensable for investors and financial institutions.
ConceptDraw DIAGRAM is a powerful intelligent vector graphics engine that can be used for basic diagramming. Various flowcharts, block diagrams, histograms, pie charts, divided bar diagrams, line graphs, circular arrows diagrams, Venn diagrams, bubble diagrams and concept maps, and others can be generated with ease and then successfully used to visually communicate business and personal ideas and concepts, general structures and activities.
You need create Company Structure Diagram quick and easy? ConceptDraw DIAGRAM extended with Organizational Charts Solution from the Management Area has become the best Organization Charting Software that will help you effectively!
Sample 1. Organizational chart - New York State Education Department.
This sample was created in ConceptDraw DIAGRAM using the Organizational Charts Solution from the Management Area of ConceptDraw Solution Park and shows the organizational structure of New York State Education Department.
Use Organizational Charts solution for ConceptDraw DIAGRAM to create your own Company Structure Diagrams in minutes.
The Company Structure Diagrams designed with ConceptDraw DIAGRAM are vector graphic documents and are available for reviewing, modifying, converting to a variety of formats (image, HTML, PDF file, MS PowerPoint Presentation, Adobe Flash or MS Visio), printing and send via e-mail in one moment.
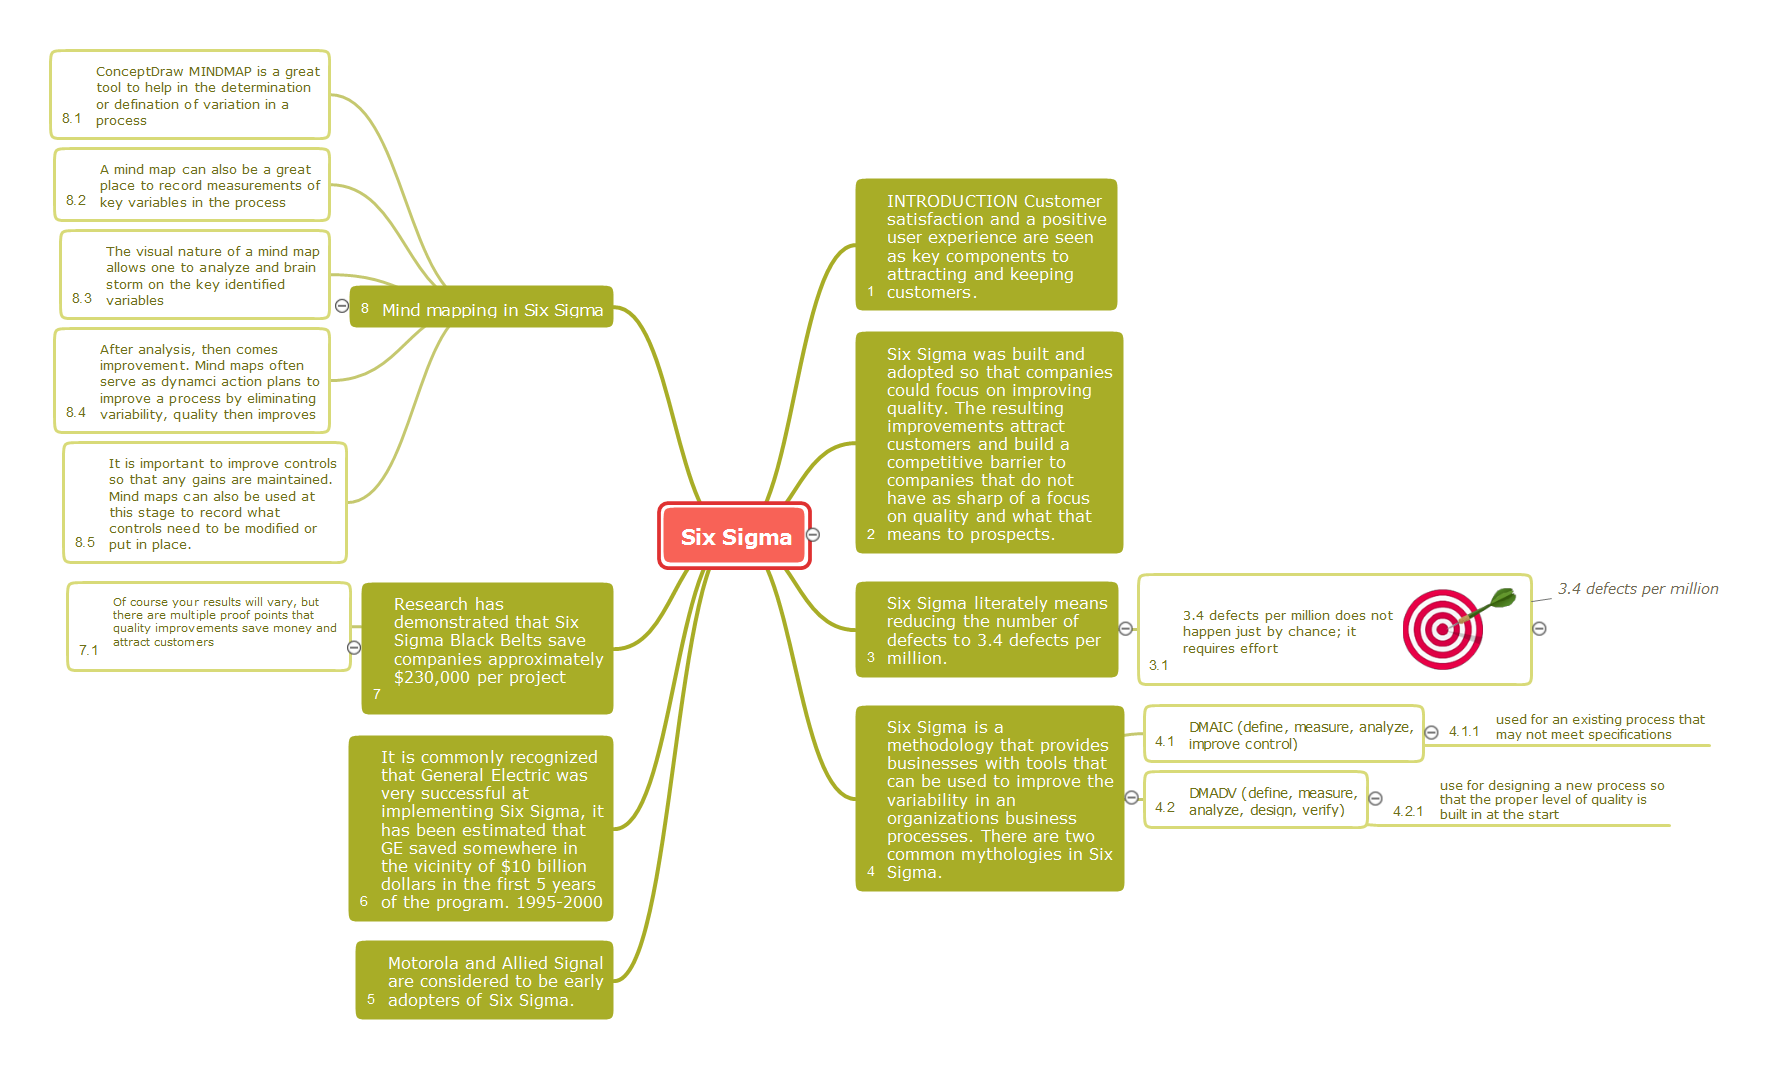
This mind map shows how Six Sigma methodology be represented as a mind map. Six Sigma is a quality management methodology allows reducing the number of defects to 3.4 defects per million.
The strategic balance is a combination of factors that can both positively and negatively affect the activity of the company. To know the factors that influence the organization success, managers should use SWOT matrix template that will define the potential inner strengths and weaknesses and potential external opportunities and threats. This matrix does not contain a ready solution, but allows to streamline all the available information.
This is a handy template of a SWOT matrix. It can serves as a visual guide for management students. To simplify the task, on the left and on the right we have added hints with examples of external and internal factors. This template one can found among numerous templates of SWOT and TOWS matrices that are included in the the eponymous solution by ConceptDraw Solution Park.
Sample Pictorial Chart - Pictorial Infographics solution provides easy-to-use design infographics drawing tools, large collection of different sample infographics and infograms, sample pictorial chart and templates to be filled in, and 10 libraries with great quantity of predesigned vector pictograms.
Use Pictorial Infographics solution to draw your own design pictorial infographics documents quick and easy.
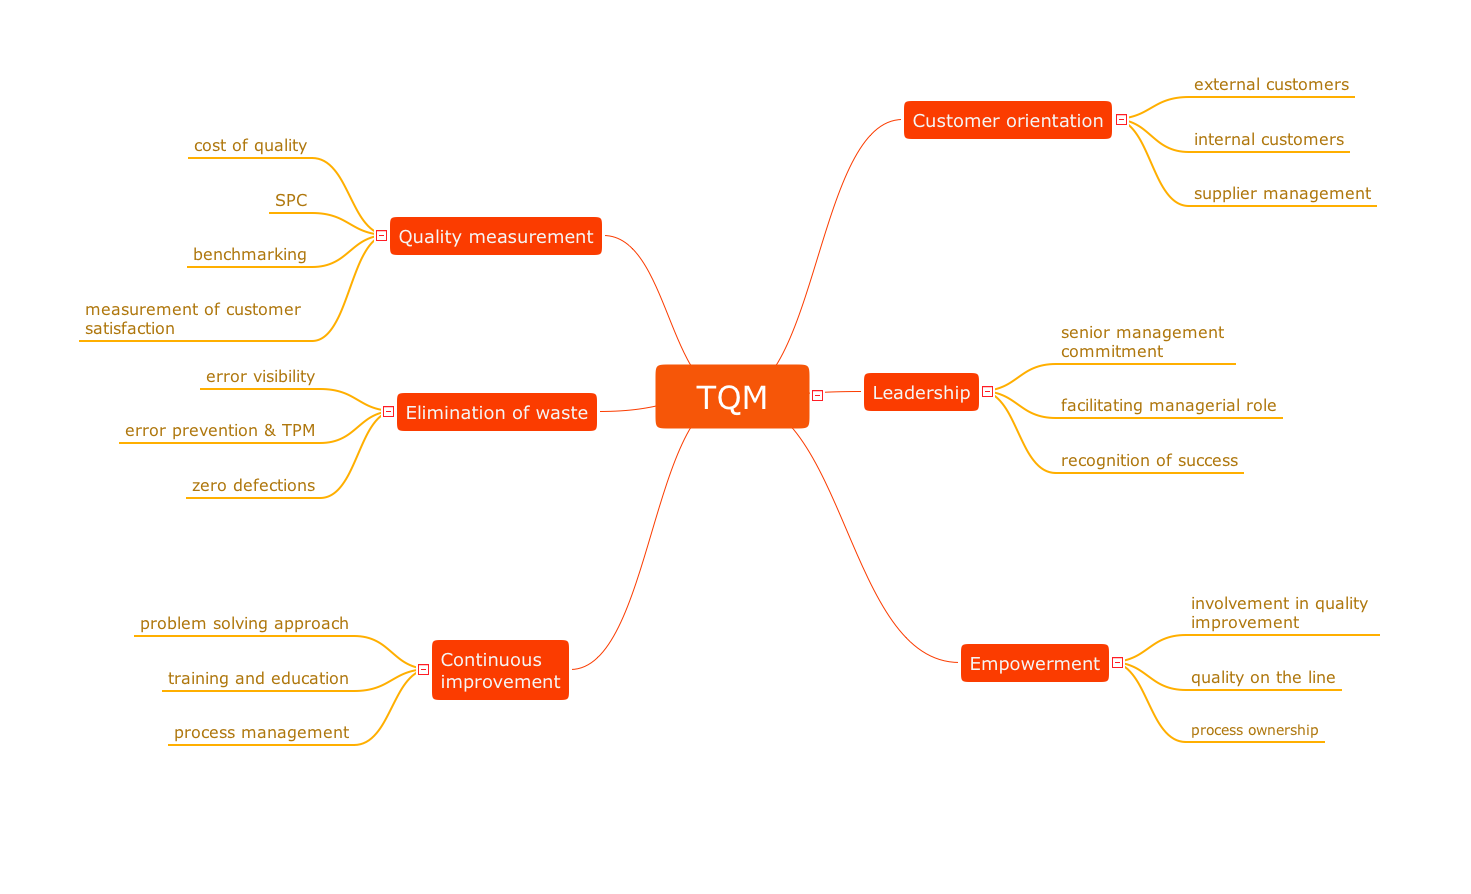
You can describe your own quality processes, brainstorm, and structure quality issues; then you can easily and quickly present it to your team.
Quality Management Mind Maps - Presentations, Meeting Agendas, Problem will be solved.
Picture: Why do you need the quality management for the organization
Any information system receives data flows from external sources. In order to visualize them there is a list of data flow diagram symbols that describes how the system components cooperate. If you want to create a data flow diagram, ConceptDraw DIAGRAM Solution Park has DFD Library that contains both Yourdon and Gane-Sarson notations.
This figure shows the content of vector libraries, delivered with ConceptDraw solution for data flow diagram (DFD). There are three libraries composed from about 50 vector objects used to make data flow diagrams.
They include a complete set of objects utilized by Yourdon-Coad and Gane-Sarson notations - two primary notations that are apply for data flow diagramming. Also, one can discover additional "Data flow diagram (DFD)" library that provides a data flow diagram elements for designing level 1 and context-level data flow diagrams.
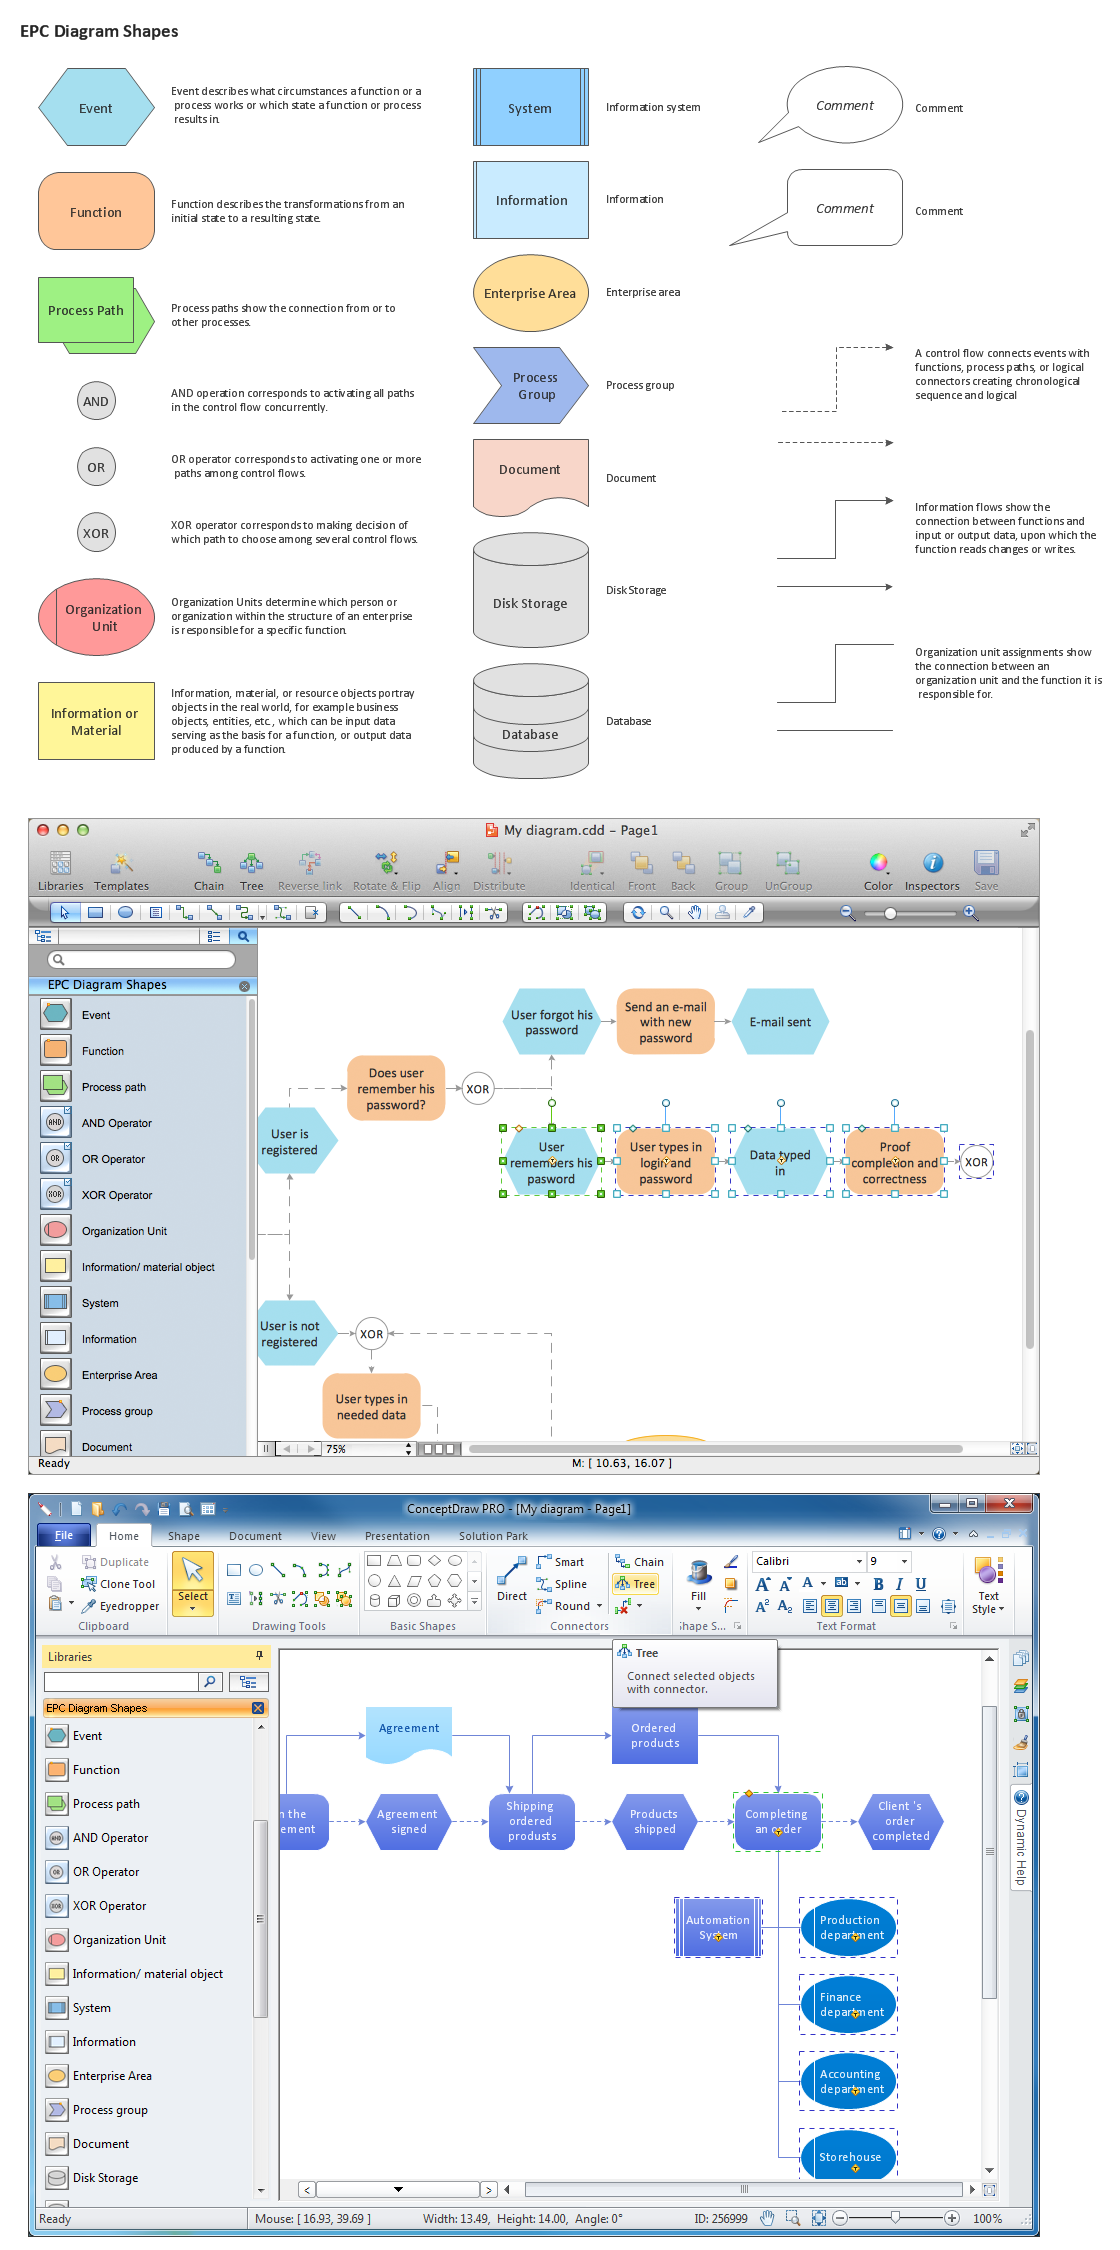
Event-Driven Process Chain Diagrams for improvement throughout an organisation.
ConceptDraw DIAGRAM - software that reduces the time needed to create a business process model.
Picture: Structuring a business process as a chain of events and functions
Event-Driven Process chain Diagrams for improvement throughout an organisation.
ConceptDraw DIAGRAM - software that reduces the time needed to create a business process model.
Picture: Elements of an Event-Driven Process Chain
When you need a drawing software to create a professional looking cross-functional charts, ConceptDraw with its Arrows10 Technology - is more than enough versatility to draw any type of diagram with any degree of complexity.
Use templates with process maps, diagrams, charts to get the drawing in minutes.
When we start to speak about databases, we must always mention database structure visualization. One of the most common ways to do it is to create an entity relationship diagram, and to put appropriate symbols on it. It is important either for database projecting and for its' future maintenance.
Entity Relationship Diagram describes data elements and their relationships within a database. There are a set of special symbols that depict each element of an entity relationship diagram. Entities - represents some stable components such as supplier, employee, invoice, client, etc. Relation symbols show how the entities interact. Attributes define characteristics of the relationships. Attributes can be one-to-one or many-to-many. Physical symbols is used in the physical models. They represent items such as fields, tables, types and keys. ERD physical symbols are the building material for the database. Notation lines are used to illustrate the relationships. The most common method is Crow’s Feet notation. You can use ConceptDraw Entity-Relationship Diagram (ERD) solution to represent a database using the Entity-Relationship model.