Database Flowchart Symbols
Database Flowchart
Database flowchart (DFD) is used to visualize data flows in information systems. DFD consists of four major components:
- entities,
- processes,
- data stores,
- data flows.
How to Create a Database Flowchart
Using the “Data Flow Diagrams” solution in ConceptDraw STORE.

Pic 1. Database Flowchart Solution
ConceptDraw DIAGRAM allows you to draw a simple and clear Database Flowchart using special libraries, provided by Data Flow Diagrams solution:
- The design elements library "Data flow diagram (DFD)" contains 15 symbols for drawing both context-level data flow diagram and Level 1 DFD.
- The design elements library "DFD, Gane-Sarson notation" contains 12 symbols of Gane-Sarson DFD notation.
- The design elements library "DFD, Yourdon and Coad notation" contains 22 symbols of Yourdon/DeMarco DFD notation.

Pic 3. Database Flowchart Symbols
Use these database flowchart symbol libraries to design the process-oriented models, data-oriented models, data flowcharts, data process diagrams, structured analysis diagrams, and information flow diagrams.
|

Pic 4. Database Flowchart Library
Result
This sample shows a CERES data flow diagram. The design is large and complex, but its creation in ConceptDraw DIAGRAM using pre-designed objects, took just minutes. Use the legend to make additional comments.

Pic 5. Database Flowchart
TEN RELATED HOW TO's:
Mind map that can be useful when planning the logistics of a conference.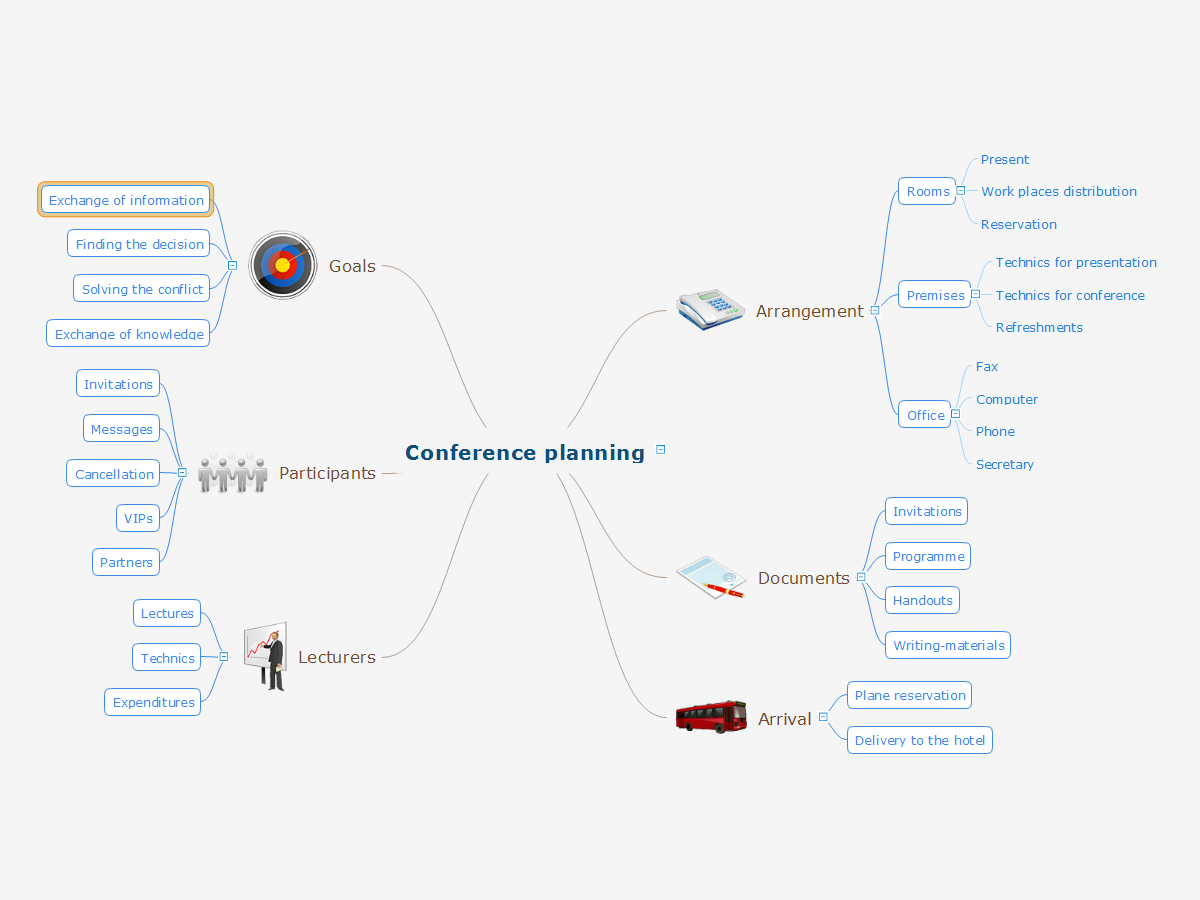
Picture: Conference Planning
Related Solution:
Onion diagram is a type of circular diagram that consists of the core circle representing the product/solution and concentric circles around it, which dependent on the core and look like the cross sections of onion.
ConceptDraw DIAGRAM diagramming and vector drawing software supplied with Stakeholder Onion Diagrams Solution from the Management Area of ConceptDraw Solution Park is an ideal software for effective Onion diagram process design.
Picture: Onion Diagram Process Design
Related Solution:
ConceptDraw DIAGRAM enhanced with Flowcharts Solution is the best flow chart maker online design software. Use it to ✔️ create clear and actionable Flowcharts, ✔️ improve decision-making, ✔️ enhance problem-solving in various scenarios, ✔️ enhance creativity and productivity across industries, ✔️ streamline workflows
Picture: Flow Chart Online
Related Solution:
Developing a software project supposes architecture first. To make it proper, you can use data flow diagram model in your current project.
The data flow diagram represents the Model of small traditional production enterprise that is made using Yourdon and Coad notation. It shows how the data is transfered through a process. According to the notation of Yourdon and Coad a process is represented by circles and data stores are drawn using parallel lines. This DFD was created using the ConceptDraw Data Flow Diagrams solution. Using this solution one can visualize data flow accordingly to the rules of two basic notations used for data flow modeling.
Picture: Data Flow Diagram Model
Related Solution:
There are many ways to describe a database structure. One of the most usual is to draw an entity relationship diagram (ERD) using a Crow’s Foot notation to represent database elements. If you don’t want to draw it on paper, you should use an appropriate software.
An entity-relationship (ER) diagram is used to show the structure of a business database. ERD represents data as objects (entities) that are connected with standard relationships symbols which Illustrate an association between entities. ERD, there is a wide range of ERD notations used by data bases architects for reflecting the relationships between the data entities. According to the crow’s foot notation relationships are drawn as single labeled lines designating a certain kinds of relationship. Crow foot notation is a most frequently used ERD standard, because of improved readability of diagrams, with a more accurate use of space on the page._Win_Mac.png)
Picture: Entity Relationship Diagram - ERD - Software for Design Crows Foot ER Diagrams
Related Solution:
A process flow chart is a sequence diagram on events, actions, tasks and decisions that are visualized in a form of inputs and outputs. Such flow chart involves a defined number of standard symbols and notation keys used to help one understand and pass the information.
Process flow charts have become a day-to-day tool for chemical engineers, technologists and production engineers as well as software developers. However, their use has recently increased in other areas such as business, manufacturing and, especially a service sector.
Picture: Example Process Flow Chart
Related Solution:
ConceptDraw Network Drawing Software - Network design software for network drawings with abundant examples and templates.
Create computer network designs, diagrams and schematics using ConceptDraw.
Picture: Network Drawing Software
A wireframe is a scheme of a future web page. Wireframe illustrates the web page structure, location and size of the main elements, as well as their interaction with the user. With such scheme designer defines the functionality of the page, not its appearance.
Picture: Wireframe Tools
Related Solution:
Data modeling is actively applied in analysis and uses wide set of methods for description the data requirements in a system. One of the most popular and well-known is the ERD method of database modeling.
The best ERD tool for the Mac and Windows is ConceptDraw DIAGRAM software extended with the Entity-Relationship Diagram (ERD) solution from the Software Development Area for ConceptDraw Solution Park, which is sharpened for professional ERD drawing and data modeling with Entity Relationship Diagram.
Picture: Data Modeling with Entity Relationship Diagram
Related Solution:
To your mind, deliberation about the profits of creating organizational charts takes more time than actually creating itself. If lack of software is the only thing that stops you, you should know that organizational charts with ConceptDraw DIAGRAM are created within a few minutes. Owing to the great number of ready-to-use templates, you’ll get your chart easily.
Chart is a very handy format for visually depicting official relations of an organization. Usually, an Orgchart (organizational chart) consists from simple geometrical shapes, containing an information on a position, personal data, and the lines that means responsibilities and accountabilities associated with position. ConceptDraw solution designed for making organizational charts enables one to create various org charts effortlessly using special templates and vector libraries.
Picture: Organizational Charts with ConceptDraw DIAGRAM
Related Solution:

