
HelpDesk
Drawing a Scatter Diagram . ConceptDraw HelpDesk
Scatter Diagrams are used to visualize how a change in one variable affects another. A Scatter Diagram displays the data as a set of points in a coordinate

Scatter Chart Examples *

Scatter Chart Examples
Scatter chart example - Number of inhabitants of Vienna

Scatter Graph Charting Software *

Scatter Graph Charting Software
Scatter chart example - German tax rate on corporate income 1995-2009
Scatter Chart Analysis. Scatter Chart Example *

Scatter Chart Analysis
Scatter Chart Analysis
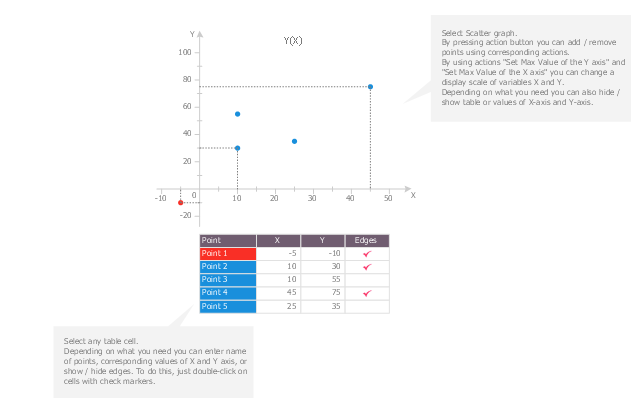
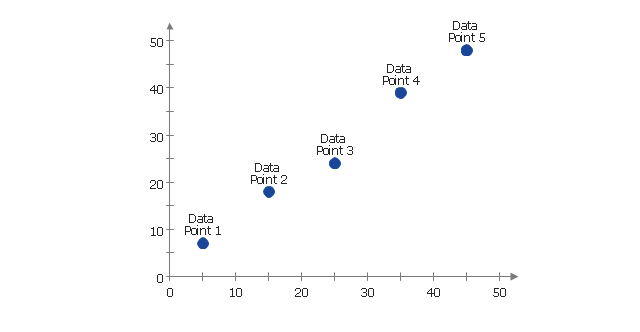
Use this scatter plot template to show values for two variables for your data series
in ConceptDraw PRO diagramming and vector drawing software. "A scatter
 Scatter Diagrams Solution. ConceptDraw.com
A Scatter Chart (other names Scatter Plot , Scatter Diagram , Scatter Graph ,
Correlation Chart) is one of the Seven Basic tools of quality control. This is a
simple

This scatter graphs (scattergraph. scatter chart , scatter plot , scatterplot , scatter
diagram ) sample show how the scatter plot with missing categories on the left,
the
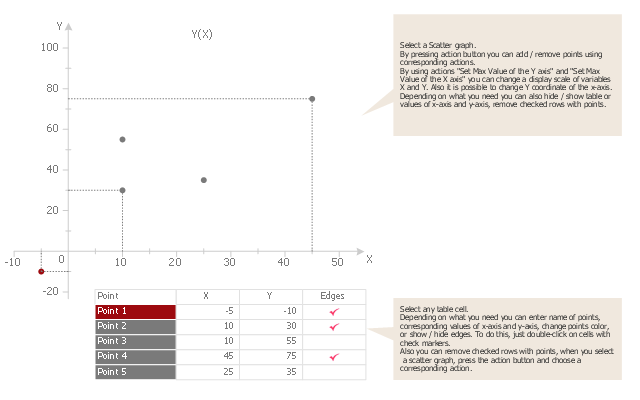
Use this template to design your scatter charts. "A scatter plot , scatterplot , or
scattergraph is a type of mathematical diagram using Cartesian coordinates to
The vector stencils library " Scatterplot " contains 8 scatter diagram templates. Use
to design your scatter graphs with ConceptDraw PRO diagramming and vector
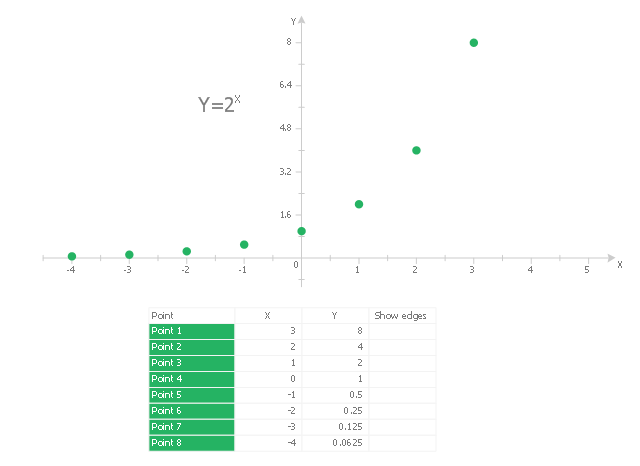
This scatter graph (scattergraph. scatter chart , scatter plot , scatterplot , scatter
diagram ) example visualizes exponent function. "Exponentiation is a
mathematical

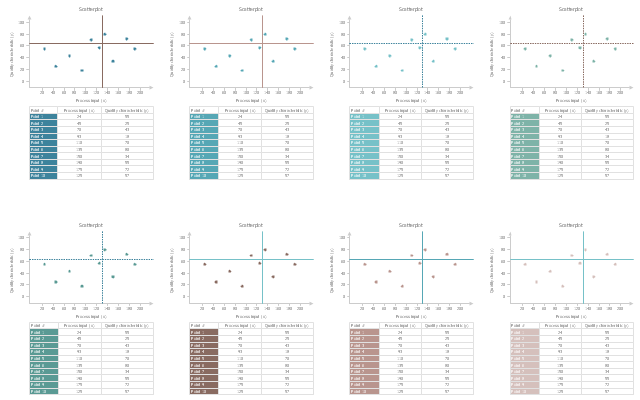
The vector stencils library Correlation charts from the Corellation Dashboard
solution contains 4 templates of scatter plots for drawing the visual dashboards
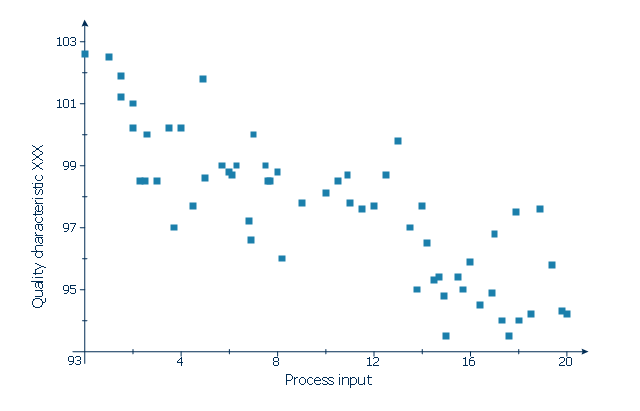
This scatter graph (scattergraph. scatter chart , scatter plot , scatterplot , scatter
diagram ) example depicts quality characteristic vs. process input. It was designed
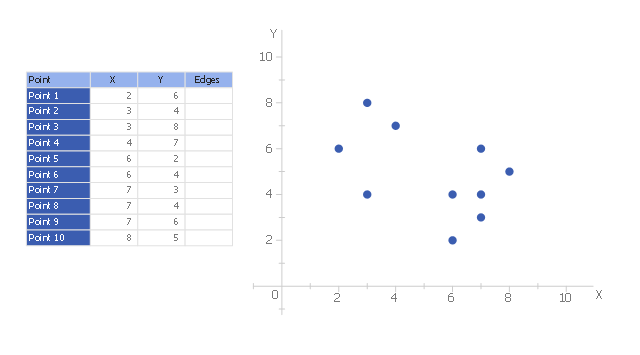
This scatter plot sample is used to illustrate the k-medoid clustering algorithm. "
The k-medoids algorithm is a clustering algorithm related to the k-means
- Basic Diagramming | Line Graph | Bar Graph | Scatter Plot On Us ...
- Scatter Diagrams | Best Diagramming | Scatter Graph | Mind Map ...
- Scatter Diagrams | Blank Scatter Plot | How to Draw a Scatter ...
- Scatter Plot | How to Draw a Scatter Diagram | Scatter Chart ...
- Scatter Diagrams | Blank Scatter Plot | Scatter Chart Examples ...
- Scatter Chart Examples | Scatter Diagrams | How to Draw a Scatter ...
- Scatter Graph Charting Software | Scatter Diagrams | How to Draw a ...
- Scatter Graph Charting Software | Scatter Chart | Scatter Diagram ...
- Scatter Diagram In Total Quality Management
- Scatter Diagrams | How to Draw a Scatter Diagram Using ...
- Baby Age And Height Scatter Plot
- Scatter Plot | Design elements - Scatterplot | Blank Scatter Plot ...
- Scatter Graph Charting Software | Scatter Chart Examples | Scatter ...
- Scatter Chart Examples | Scatter Diagram | Blank Scatter Plot ...
- Scatter Diagram In Tqm
- Scatter Chart Examples | Blank Scatter Plot | Scatter Plot | Scatter ...
- Scatter Graph Charting Software | Scatter Plot Graph | Scatter Chart ...
- Scatter Chart Examples | Bubble Plot | Four Dimensions Bubble Plot ...
- Blank Scatter Plot | Scatter Chart Examples | Scatter Plot | How To ...
- Design elements - Marketing charts | Scatter Chart Examples ...