
Scatter Graph Charting Software
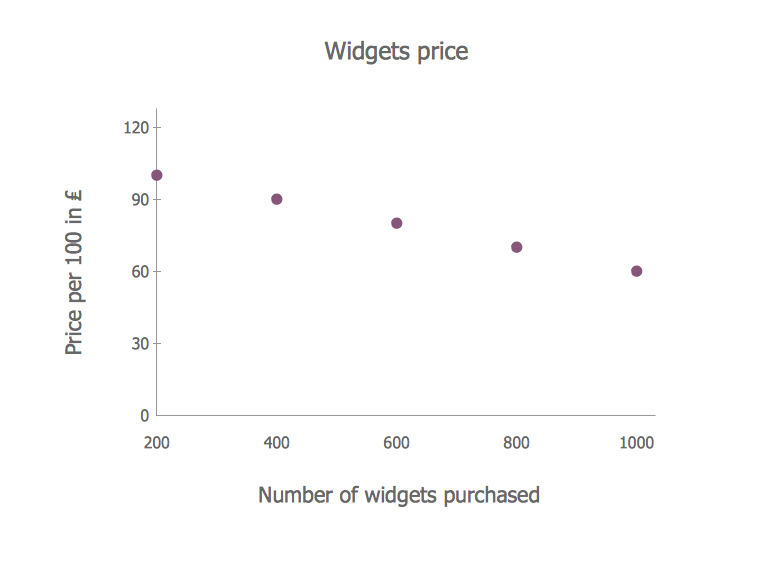
Scatter chart example - German tax rate on corporate income 1995-2009
 Scatter Diagrams Solution. ConceptDraw.com
The Scatter Diagrams solution extends ConceptDraw PRO v10 functionality with
templates, samples, and a library of vector stencils that make construction of a
Scatter Plot easy. The Scatter Chart Solution makes it easy to design attractive
Scatter Diagrams used in various fields of science, work, and life activities.

HelpDesk
Drawing a Scatter Diagram . ConceptDraw HelpDesk
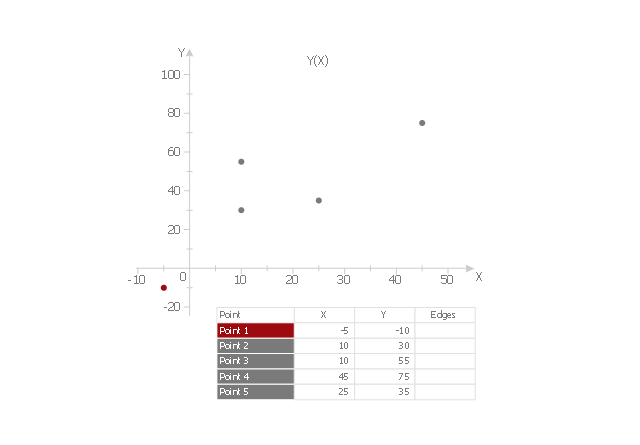
Scatter Diagrams are used to visualize how a change in one variable affects another. A Scatter Diagram displays the data as a set of points in a coordinate system. It combines these values into single data points and displays them in uneven intervals. A Scatter Diagram can be very useful to for identifying relationships


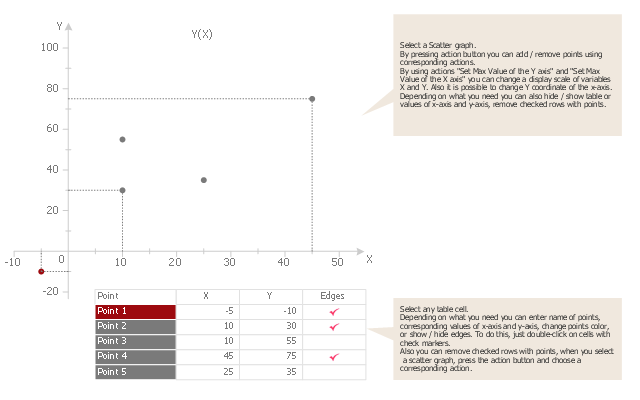
Use this template to design your scatter charts. "A scatter plot , scatterplot, or
scattergraph is a type of mathematical diagram using Cartesian coordinates to
display values for two variables for a set of data. The data is displayed as a
collection of points, each having the value of one variable determining the
position on the
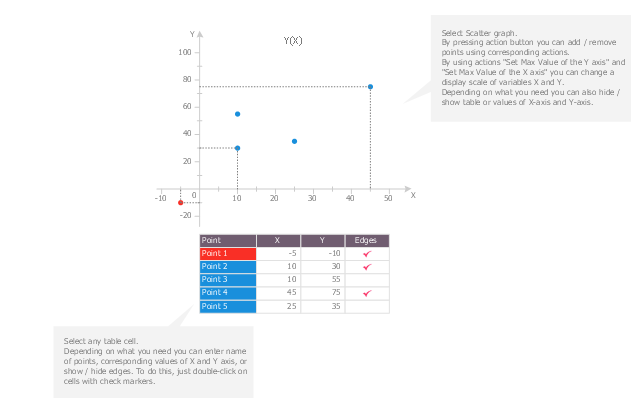
Use this scatter plot template to show values for two variables for your data series
in ConceptDraw PRO diagramming and vector drawing software. "A scatter plot ,
scatterplot, or scattergraph is a type of mathematical diagram using Cartesian
coordinates to display values for two variables for a set of data. The data is
The vector stencils library " Scatter graphs " contains 7 templates of scatter
diagrams (scattergraphs, scatter charts, scatter plots , scatterplots, scatter
diagrams ) for visual analysis of correlation between two variables. Use these
shapes to draw your scatterplots in the ConceptDraw PRO diagramming and
vector drawing
- Scatter Chart Examples | Scatter Diagrams | How to Draw a Scatter ...
- Scatter Diagrams | How to Draw a Scatter Diagram Using ...
- Basic Diagramming | Scatter Graph | How To Create Restaurant ...
- Scatter Diagrams | Best Diagramming | Scatter Graph | Mind Map ...
- Scatter Diagrams | Blank Scatter Plot | Scatter Chart Examples ...
- Scatter Diagrams | Basic Scatter Diagrams | Total Quality ...
- How to Draw a Scatter Diagram Using ConceptDraw PRO | Scatter ...
- Scatter Diagrams | Blank Scatter Plot | How to Draw a Scatter ...
- Baby height by age | Scatter Diagrams | Baby Age And Height ...
- Scatter Diagrams | Scatter Graph Charting Software | Scatter Graph ...