Use this circle chart template to design your sector diagrams.
"A chart is a graphical representation of data, in which the data is represented by symbols, such as ... slices in a pie chart. ... Charts are often used to ease understanding ... the relationships between parts of the data. ... For example, data that presents percentages in different groups (such as "satisfied, not satisfied, unsure") are often displayed in a pie chart ... A pie chart shows percentage values as a slice of a pie." [Chart. Wikipedia]
The template "Sector diagram" for the ConceptDraw PRO diagramming and vector drawing software is included in the Pie Charts solution of the Graphs and Charts area in ConceptDraw Solution Park.
Circle chart

 Stakeholder Onion Diagrams
The Stakeholder Onion Diagram is often used as a way to view the relationships of stakeholders to a project goal. A basic Onion Diagram contains a rich information. It shows significance of stakeholders that will have has influence to the success achieve
How To Create Onion Diagram

Pie Chart Examples and Templates

Onion Diagram Process Design

Onion Diagram Templates

Stakeholder Mapping Tool

Onion Diagram Maker

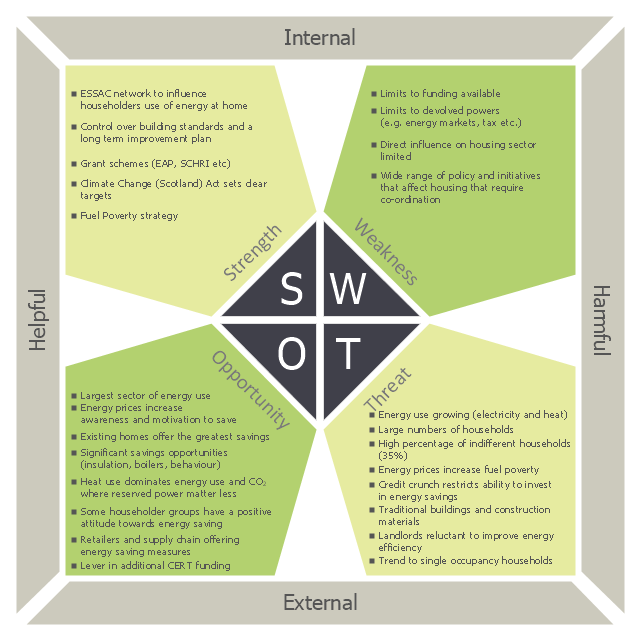
This sample was created on the base of the SWOT matrix illustrating the webpage "SWOT Analysis" of "Scottish Energy Study Volume 4: Issues, Opportunities and Barriers" from the website of the Scottish Government. [scotland.gov.uk/ Publications/ 2009/ 09/ 24094712/ 6]
The diagram example "Domestic sector SWOT" was created using the ConceptDraw PRO diagramming and vector drawing software extended with the SWOT Analysis solution from the Management area of ConceptDraw Solution Park.
The diagram example "Domestic sector SWOT" was created using the ConceptDraw PRO diagramming and vector drawing software extended with the SWOT Analysis solution from the Management area of ConceptDraw Solution Park.
SWOT matrix
Stakeholder Onion Diagram Template

Stakeholder Onion Diagrams

Bar Diagrams for Problem Solving. Create manufacturing and economics bar charts with Bar Graphs Solution

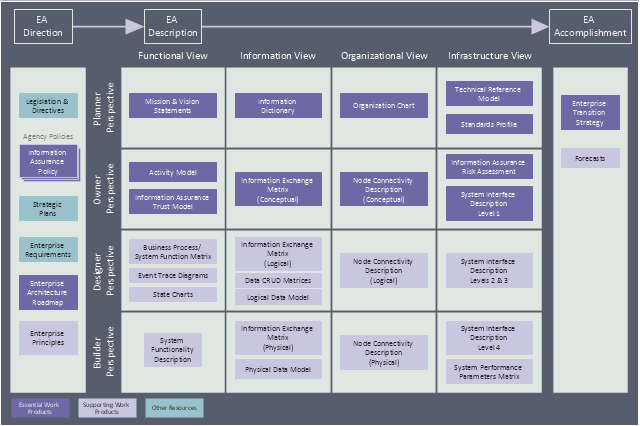
This enterprise architecture diagram sample was redesigned from the Wikipedia file: TEAF Work Products for EA Direction, Description, and Accomplishment.jpg. [en.wikipedia.org/ wiki/ File:TEAF_ Work_ Products_ for_ EA_ Direction,_ Description,_ and_ Accomplishment.jpg]
"Treasury Enterprise Architecture Framework (TEAF) was an Enterprise architecture framework for treasury, based on the Zachman Framework. It was developed by the US Department of the Treasury and published in July 2000. May 2012 this framework has been subsumed by evolving Federal Enterprise Architecture Policy as documented in "The Common Approach to Federal Enterprise Architecture".
The material presented here is obsolete and only useful for historical reference and is not the current policy in use by the Department of the Treasury." [en.wikipedia.org/ wiki/ Treasury_ Enterprise_ Architecture_ Framework]
The enterprise architecture diagram example "Resources and TEAF Work Products for EA Direction, Description, and Accomplishment" was created using the ConceptDraw PRO diagramming and vector drawing software extended with the Enterprise Architecture Diagrams solution from the Management area of ConceptDraw Solution Park.
Enterprise architecture diagram
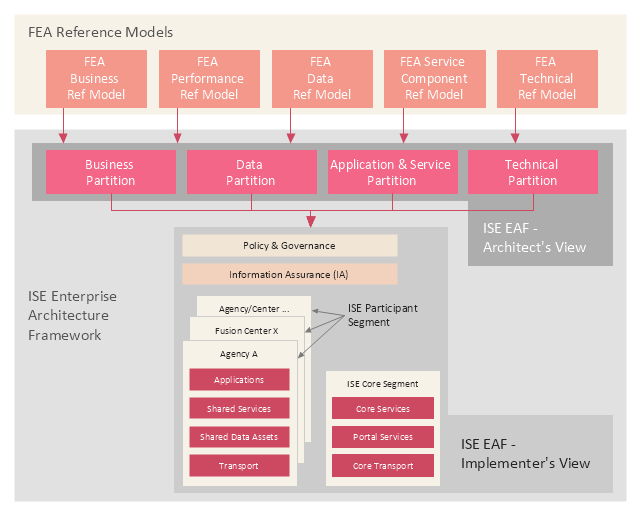
This enterprise architecture diagram example was drawn on the base of the figure illustrating the webpage "ISE Enterprise Architecture Framework 2007" from the Semantic Community website. "The ISE Enterprise Architecture Framework.
As Figure ... depicts, the Federal Enterprise Architecture (FEA) Reference Models (RMs) provide the basis for the ISE EAF. All elements of the ISE EAF are mapped back to elements of the FEA RMs with the FEA management processes applied by the OMB leveraged in support of implementing the ISE. The four ISE EAF partitions are mapped to the five FEA RMs to enable tracking the development of the ISE EAF across agencies using standardized OMB policies and processes that structure EA development and budgeting processes. The ISE EAF also provides an overarching mapping of the ISE into not only Federal civil systems, but also national security systems. ...
Two primary views are used to describe the ISE EAF: 1) the Architect’s View and 2) the Implementer’s View. While the term “view” is typically used to refer to different aspects of an architecture, the OMB suggested the term “partition” rather than the more common terms “architecture” or “view” to differentiate the ISE approach as a framework from the approach typically used in departmental and agency EAs. The Architect’s View comprises four partitions:
1) Business,
2) Data,
3) Application and Service, and
4) Technical.
The Architect’s View is used to provide structural alignment of the ISE architectural components into the FEA structure to ensure strategies, business processes, investments, data, systems, and technologies within the ISE are integrated and compatible with those across the Federal government."
[semanticommunity.info/ Information_ Sharing_ Environment/ ISE_ Enterprise_ Architecture_ Framework_ 2007#Figure_ ES-2._ The_ ISE_ Enterprise_ Architecture_ Framework_ Is_ Defined_ by_ Two_ Views_ and_ Four_ Partitions]
The diagram example "The ISE Enterprise Architecture Framework" was created using the ConceptDraw PRO diagramming and vector drawing software extended with the Enterprise Architecture Diagrams solution from the Management area of ConceptDraw Solution Park.
Enterprise architecture diagram
SWOT Matrix

Visualize Stakeholder Analysis

Stakeholder Management System

This step chart sample shows engineering value chain. It was designed on the base of the Wikimedia Commons file: The engineering value chain.png. "The engineering value chain (EVC) refers to a series of engineering activities and capabilities contributing to value creation encompassing essential elements such as idea generation & selection, design & development, production & delivery, service & support, and disposal & recycling for example." [commons.wikimedia.org/ wiki/ File:The_ engineering_ value_ chain.png]
This file is licensed under the Creative Commons Attribution-Share Alike 3.0 Unported license. [creativecommons.org/ licenses/ by-sa/ 3.0/ deed.en]
The diagram example "Step chart - Value chain" was created using the ConceptDraw PRO diagramming and vector drawing software extended with the Marketing Diagrams solution from the Marketing area of ConceptDraw Solution Park.
Marketing diagram

Process Flowchart


HelpDesk
How to Create an Enterprise Architecture Diagram in ConceptDraw PRO

- Business Sector Diagram Sample
- Sector diagram - Template
- Sector diagram template | Enterprise architecture diagram | Design ...
- Sector weightings - Exploded pie chart | Bar Diagrams for Problem ...
- Sector weightings - Exploded pie chart | Domestic sector SWOT ...
- Sector weightings - Exploded pie chart | Stakeholder Onion ...
- Stakeholder Onion Diagrams | Primary Sector Flow Diagram
- The Diagram Of The Business Sector And Its Examples
- Affinity Diagram Example Prepared By Financial Sector
- Pie Chart Examples | Bar Chart Examples | Flow Chart Diagram ...
- Onion Diagram With 3 Sectors Template
- Examples Of A Diagram In A Primary Sector
- AWS Simple Icons for Architecture Diagrams | Design elements ...
- Bar Diagrams for Problem Solving. Create manufacturing and ...
- SWOT analysis for a small independent bookstore | Domestic sector ...
- Business process diagram BPMN 1.2 - Hiring process | How to Draw ...
- Leaky bucket diagram
- Design elements - Telecommunication networks ...
- Leaky bucket diagram | Marketing Diagrams | Leaky Bucket Tgeory
- NIH IT enterprise architecture framework | Enterprise architecture ...