What is Gantt Chart (historical reference)
Historical reference about the Gantt chart.Gant Chart in Project Management
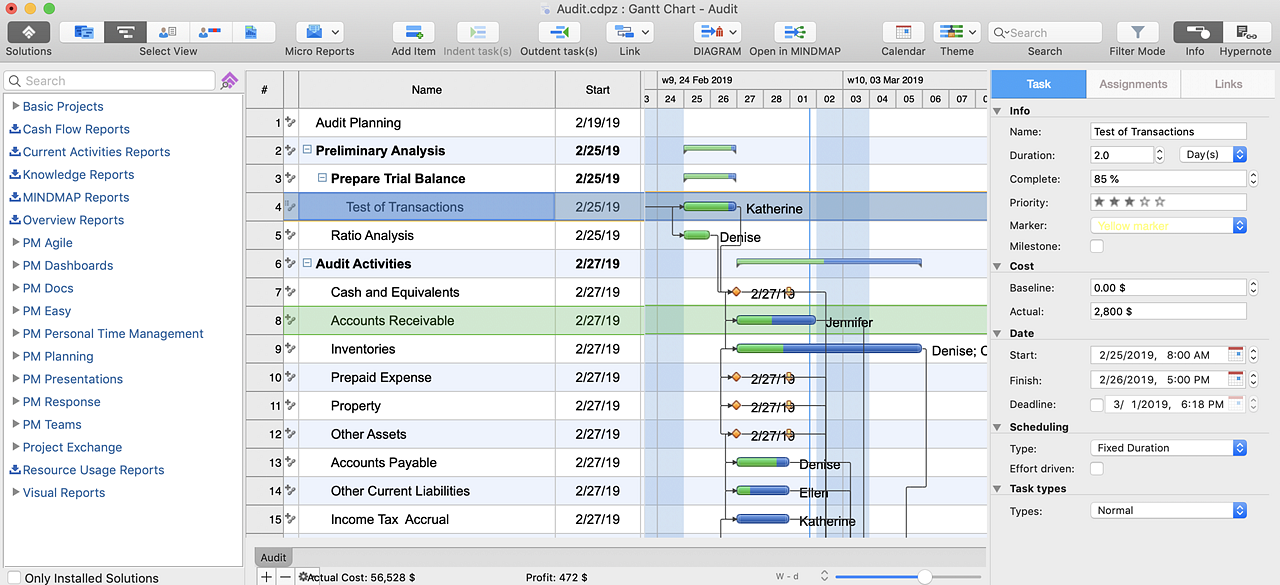
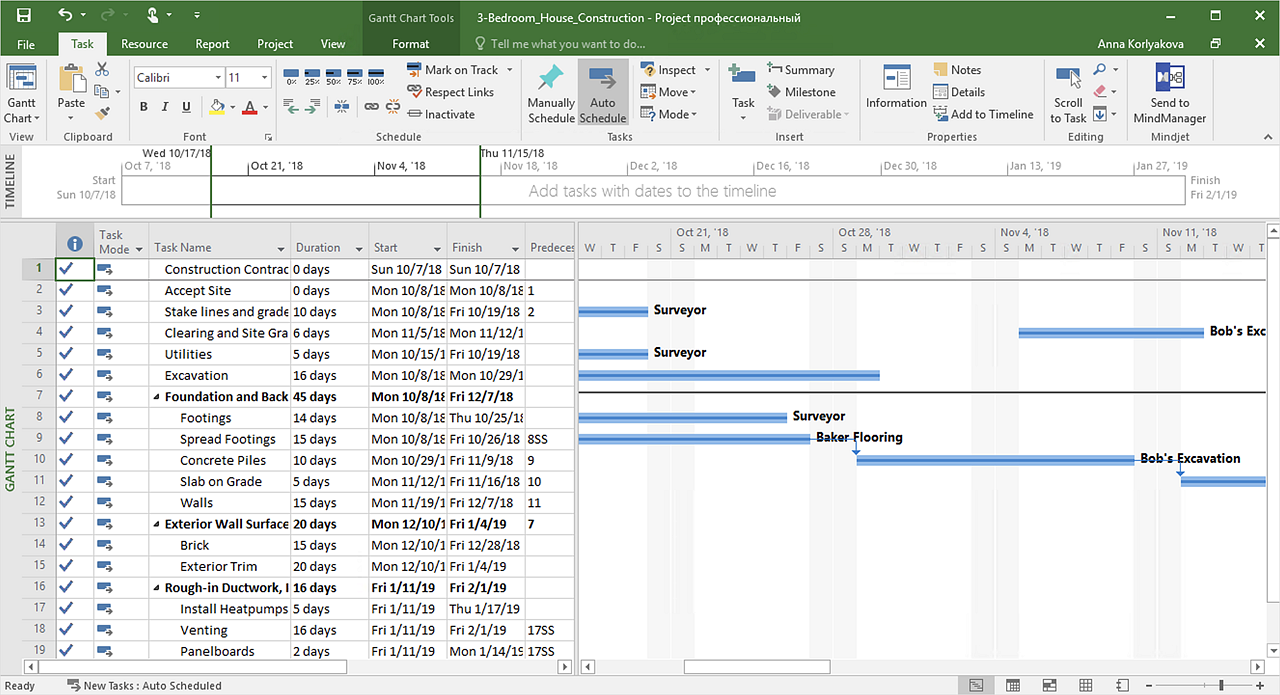
Gantt Chart is a graphical representation of tasks as segments on a time scale. It helps plan and monitor project development or resource allocation. There are list of tasks, project milesones and stages. The horizontal axis is a time scale, expressed either in absolute or relative time. Gantt chart can be used for planning in virtually any industry. There are major project planning tools using gantt chart for creating project plan. For instance, using ConceptDraw PROJECT together with ConceptDraw MINDMAP for planning marketing actions is very effective way. It makes ConceptDraw Office best marketing project management software for gantt chart planning marketing message, scheduling stages when to send massive text messages or when use email marketing services in specific projects. There are simple steps on how to use project management software for marketing, sales actions and product support. This is simple all in one toolbox for managers who need best project management software for small business as for planning and brainstorming as for reporting at project execution stage. Using gantt charts together with mindmap visuals and professional presentations charts make it excellent creative project management software. ConceptDraw PROJECT is portfolio project management software it allows manage many projects with multi gantt chart.
How to Create Presentation of Your Project Gantt Chart
During the planning, discussing and execution of a project you may need to prepare a presentation using project views such as the Gantt Chart, Multiproject Dashboard or Resource Usage View. It’s easy do with ConceptDraw PROJECT!What Constitutes a Project?
Separated into categories of Basic, Intermediate, and Advanced categories, the new instructional videos about ConceptDraw PROJECT cover a huge breadth of topics, explaining how to use project management software. Users new to ConceptDraw PROJECT will find the Basic lessons an essential platform for familiarizing themselves with the programs′s functions and found it simple project management software. This video lesson is the first in Basic lessons series tells about affordable simple project management software, it may be used as an intro for what is project management using simple project management sample. ConceptDraw PROJECT is excellent portfolio project management software, this lessons explains how to use project management software for small business in case of multi project environment.
HelpDesk
How to Set a Project Baseline
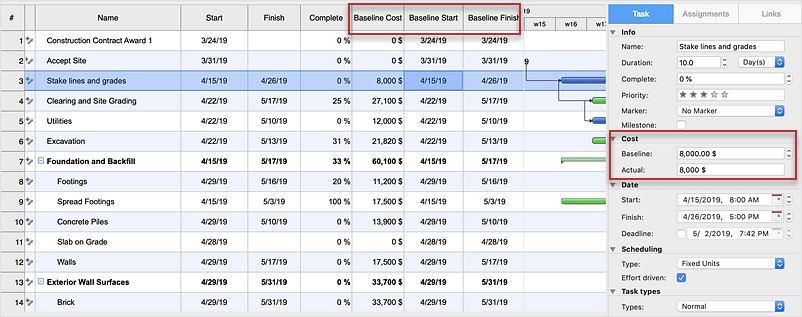
Project baseline in ConceptDraw PROJECT is excellent for guiding the execution of the current project and can be useful for further projects.HelpDesk
How to Create Floating Topics in a Mind Map
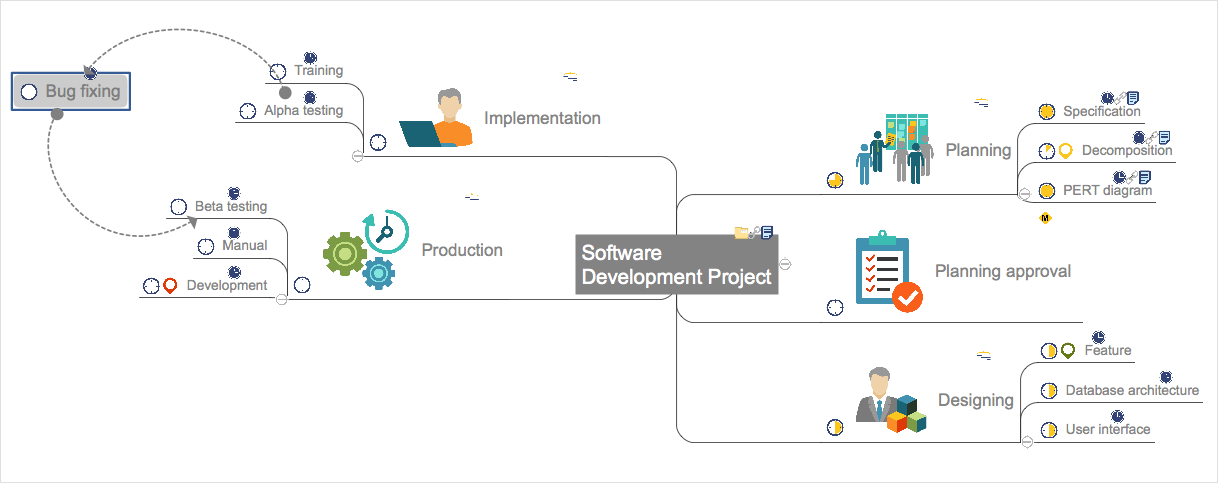
With ConceptDraw MINDMAP you have the ability to create floating topics that are not connected to the mind map structure. Since a floating topic is not connected to any other topics on the mind map, you can use it for future development of your main idea. This is a good way to make comments that relate to the entire map and not a separate topic.HelpDesk
How to Identify Project Milestones
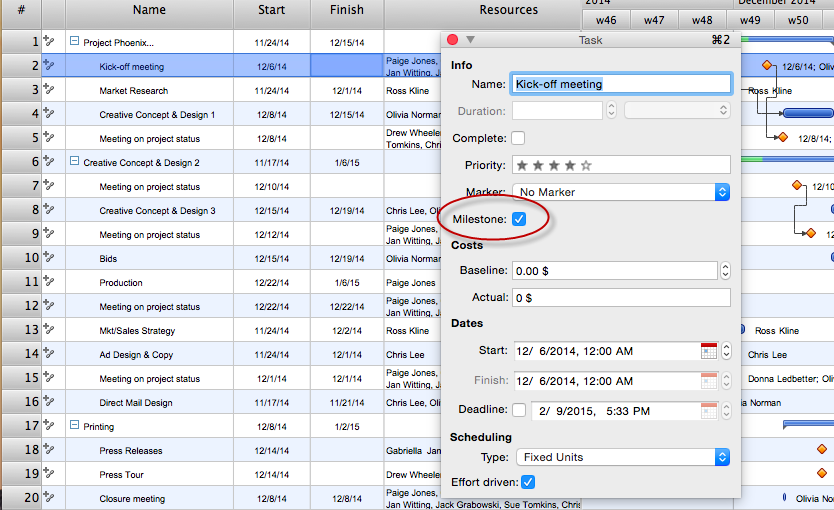
In ConceptDraw PROJECT you can easily turn any task from a project schedule into a milestone. Here are some tips on how to set milestones in a project file."Project planning is part of project management, which relates to the use of schedules such as Gantt charts to plan and subsequently report progress within the project environment.
Initially, the project scope is defined and the appropriate methods for completing the project are determined. Following this step, the durations for the various tasks necessary to complete the work are listed and grouped into a work breakdown structure. Project planning is often used to organize different areas of a project, including project plans, work loads and the management of teams and individuals. The logical dependencies between tasks are defined using an activity network diagram that enables identification of the critical path. Float or slack time in the schedule can be calculated using project management software. Then the necessary resources can be estimated and costs for each activity can be allocated to each resource, giving the total project cost. At this stage, the project schedule may be optimized to achieve the appropriate balance between resource usage and project duration to comply with the project objectives. Once established and agreed, the project schedule becomes what is known as the baseline schedule. Progress will be measured against the baseline schedule throughout the life of the project. Analyzing progress compared to the baseline schedule is known as earned value management.
The inputs of the project planning phase include the project charter and the concept proposal. The outputs of the project planning phase include the project requirements, the project schedule, and the project management plan." [Project planning. Wikipedia]
The flow chart example "Project planning process" was created using the ConceptDraw PRO diagramming and vector drawing software extended with the Flowcharts solution from the area "What is a Diagram" of ConceptDraw Solution Park.
Product Overview
ConceptDraw PROJECT is a vigorous tool for managing single or multiple projects. It lets you determine all essential elements involved into project, control schedules, resources and finances, and monitor projects' progress in most effective yet simple manner.In searching of alternative to MS Visio for MAC and PC with ConceptDraw DIAGRAM
Undoubtedly MS Visio is a powerful and multifunctional tool, but however at times occur the instances, when it turns unable of meeting certain users' requirements. At this cases you may need to use an alternative program software, preferably it will be simple, convenient, and at the same time powerful and professional. In searching the alternative to MS Visio for MAC and PC we recommend you to pay attention for ConceptDraw DIAGRAM software, which was developed to satisfy all your drawing needs and requirements. It is a fully-functioned alternative product to MS Visio for both platforms. ConceptDraw DIAGRAM software has many advantages, the main among them are the cross-platform compatibility, a reasonable price, widespread ConceptDraw Solution Park with huge variety of different solutions that offer numerous libraries of specialized vector objects, useful examples, samples, and quick-start templates, extensive import / export capabilities, built-in script language, MS Visio support and certainly free technical support.HelpDesk
How to Improve a Project by Using a Mind Map
The InGyre technology provided in ConceptDraw Office makes it easy to copy one or more task branches from ConceptDraw MINDMAP to ConceptDraw PROJECT.HelpDesk
How to Input Data from MS Excel Into a Mind Map
Many people apply Excel documents to store data in the form of hierarchical lists. With ConceptDraw MINDMAP you can easily turn the linear structure of an Excel table in a radial structure of mind map ConceptDraw MINDMAP will create a mind map file (CDMZ) from your Excel (XLS) file. If you keep your information in the Microsoft Excel files, you can import them into ConceptDraw MINDMAP, converting the columns and rows to a hierarchically structured mind map. If you have multiple individual sheets in your Excel workbook, ConceptDraw MINDMAP will turn them into a single multi-page mind map. ConceptDraw MINDMAP lets you import an entire Microsoft® Excel file as well as insert data from the selected cells.HelpDesk
How to Support Your Mind Map with Visual Elements
Symbols and images that you can add to ideas in your mind map help to extend the meaning and add context to topics. These visual elements can be used to depict priority, types of actions (phone calls, meetings, emails, etc), and kinds of information or ideas. You can easily incorporate images and symbols into your mind maps making them even more memorable and brain friendly.HelpDesk
How to Plan Projects Effectively Using Solutions
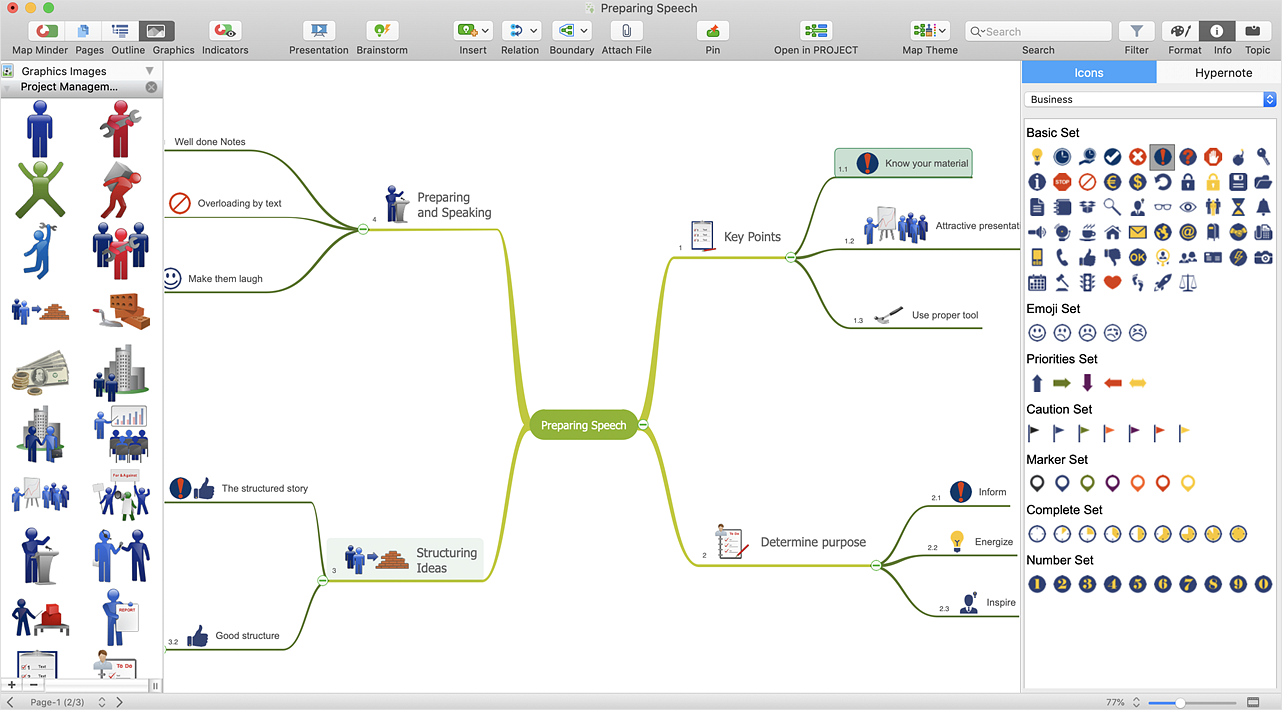
You can turn a project mind map into a Gantt chart. The advanced data exchange capabilities of ConceptDraw MINDMAP and ConceptDraw PROJECT allows you to view your mind map as a Gantt chart. This way you are switching between views of the same file.HelpDesk
How to Share Mind Maps via Internet
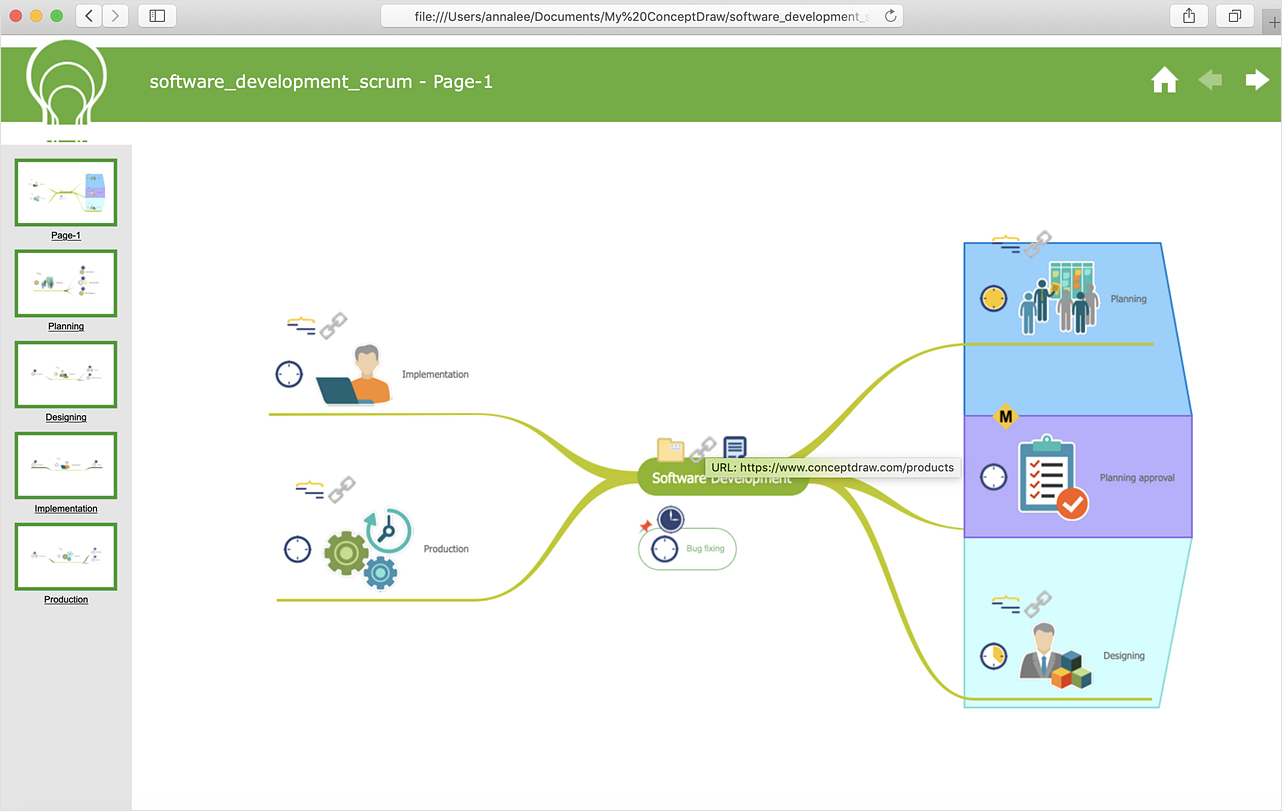
ConceptDraw MINDMAP provides a variety of export capabilities to help with that situation. Exporting the mind map to HTML format, preserving the links so they can be used to download documents.HelpDesk
How to Use the Effort-Driven Scheduling Method
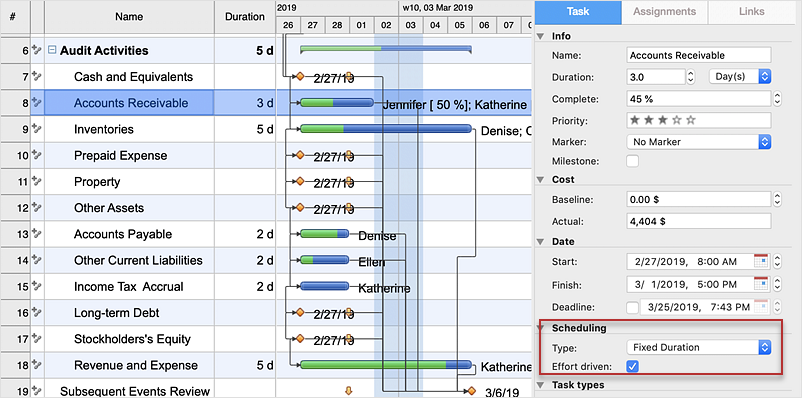
The idea of Effort-driven scheduling in project management is that each project task can be scheduled and assumed basing to the amount of the available work hours. Effort-driven scheduling is used as the default method of project scheduling in ConceptDraw PROJECT. This means that task duration, units, and work amount for individual assignment depend on the entire work, required for a given task. Whether you add or remove resources, the total work amount still the same, while the ConceptDraw PROJECT regulates the duration of task or units assigned for the given resources.HelpDesk
How to Convert a Mind Map into MS Project XML
The easiest way to start this project is to conduct a brainstorm session that identifies necessary tasks, then prepare a project schedule in the form of a Gantt chart and assign resources to tasks. With ConceptDraw MINDMAP, you can initiate a project using a mind map to represent all critical and important tasks. ConceptDraw MINDMAP supports a mind map export to MS Project; it also allows import a project file from MS Project giving team members who use OS X or Windows a working visual map of a planned project.Activity on Node Network Diagramming Tool
Activity on Node Network Diagramming Tool — Activity Network and Project Evaluation and Review Technique, or PERT, charts are a way of documenting and analyzing the tasks in a project. This sample shows the Activity on node network diagramming method. It was created in ConceptDraw DIAGRAM diagramming and vector drawing software using the Seven Management and Planning Tools solution from the Management area of ConceptDraw Solution Park.HelpDesk
How to Format a Mind Map on Mac
In ConceptDraw MINDMAP, you can customize the appearance of a mind map by changing topic shape, text colors and font; fill colors and patterns; line weight and style. Using the full range of formatting capabilities you can create aesthetically appealing mind map which can be the key to the effective presentation of your ideas.- What is Gantt Chart (historical reference) | | Business Diagram ...
- Gantt charts for planning and scheduling projects | Gant Chart in ...
- Gant Chart in Project Management | Gantt charts for planning and ...
- Gantt chart examples | Examples of Flowcharts, Org Charts and ...
- How To Plan and Implement Projects Faster | What is Gantt Chart
- How to Report Task's Execution with Gantt Chart | How to Create ...
- How to Report Task's Execution with Gantt Chart ... - Conceptdraw.com
- How to Draw an Organization Chart | Pie Chart Examples and ...
- Gantt chart examples | Gant Chart in Project Management | Gantt ...
- Pyramid Diagram | Gant Chart in Project Management | PERT chart ...
- Construction Project Chart Examples | Gantt chart examples ...
- Gantt chart examples | How To Plan and Implement Projects Faster ...
- How to Create Gantt Chart | Create Response Charts | Activity ...
- Gantt charts for planning and scheduling projects | Gantt chart ...
- Gant Chart in Project Management | Gantt charts for planning and ...
- Gantt chart examples | Gantt charts for planning and scheduling ...
- Project — Working With Costs | Gant Chart in Project Management ...
- Gant Chart in Project Management | What Constitutes a Project ...
- What is SWOT Analysis in Marketing
- Project — Working With Costs | Gantt Chart Software | What ...


