UML Class Diagram Example for Transport System

UML Class Diagram Example for GoodsTransportation System

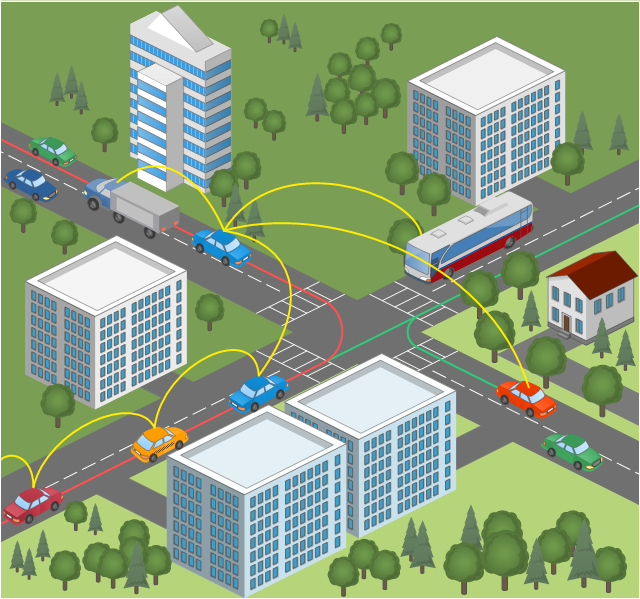
This vehicular network diagram sample was drawn on the base of picture illustrating the post "Intelligent transportation system" from the blog "Technology New Here".
"Intelligent transportation systems are projects that aim to integrate modern communication and information technology into existing transportation management systems in order to optimize vehicle life, fuel efficiency, safety, and traffic in urbanized cities.
The need for intelligent transportation systems stems from the fact that traffic congestion has been increasing all around the world because of increasing population, increasing amount of transportation vehicles and increasing urbanization."
[technologynewhere.wordpress.com/ 2010/ 05/ 12/ intelligent-transportation-system/ ]
The vehicular network diagram example "Intelligent transportation system" was created using the ConceptDraw PRO diagramming and vector drawing software extended with the Vehicular Networking solution from the Computer and Networks area of ConceptDraw Solution Park.
Vehicular network diagram
Used Solutions
Diagramming Software for Design UML Activity Diagrams


 Vehicular Networking
The Vehicular Networking solution extends the ConceptDraw DIAGRAM software functionality with specialized tools, wide variety of pre-made vector objects, collection of samples and templates in order to help network engineers design vehicular network diagrams for effective network engineering activity, visualize vehicular networks, develop smart transportation systems, design various types of vehicle network management diagrams, regional network diagrams, vehicular communication system diagrams, vehicular ad-hoc networks, vehicular delay-tolerant networks, and other network engineering schemes.
Rail transport - Design elements

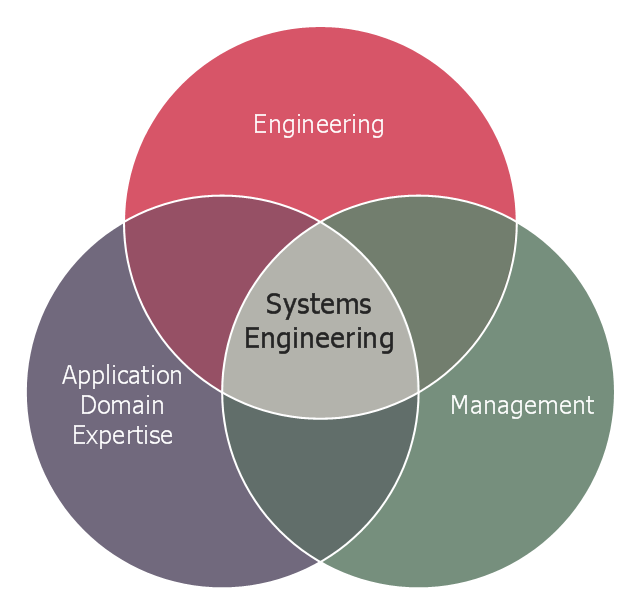
This Venn diagram sample shows the system engineering at the intersection of enginnering, management, and application domain expertise. It was designed on the base of the Venn diagram on the webpage "Intelligent Transportation Systems (ITS) ePrimer, Module 2: Systems Engineering" from the website of the Office of the Assistant Secretary for Research and Technology (OST-R), the U.S. Department of Transportation (US DOT).
"The term interdisciplinary is a fundamental concept in systems engineering. To successfully develop a system requires the application of basic engineering discipline, management discipline, and expertise in the application domain of the system. In the case of ITS, that application domain is transportation engineering. The intersection of these disciplines is the realm of systems engineering."
[pcb.its.dot.gov/ eprimer/ module2.aspx]
The Venn diagram example "Systems engineering improvement" was created using the ConceptDraw PRO diagramming and vector drawing software extended with the Venn Diagrams solution from the area "What is a Diagram" of ConceptDraw Solution Park.
Venn diagram
UML Composite Structure Diagram

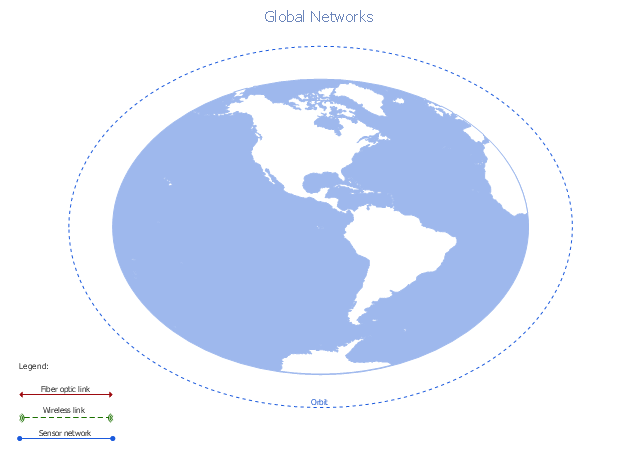
A conceptual diagram of a global vehicular network describes the principles of communication between vehicles, earth-based nodes, and space-based nodes in a wireless network. It illustrates the concept of architecture within global vehicular networks.
"Intelligent transportation systems (ITS) are advanced applications which, without embodying intelligence as such, aim to provide innovative services relating to different modes of transport and traffic management and enable various users to be better informed and make safer, more coordinated, and 'smarter' use of transport networks.
...
Intelligent transport systems vary in technologies applied, from basic management systems such as car navigation; traffic signal control systems; container management systems; variable message signs; automatic number plate recognition or speed cameras to monitor applications, such as security CCTV systems; and to more advanced applications that integrate live data and feedback from a number of other sources, such as parking guidance and information systems; weather information; bridge deicing systems; and the like." [Intelligent transportation system. Wikipedia]
The global vehicular network diagram template is included in the Vehicular Networking solution from the Computer and Networks area of ConceptDraw Solution Park.
Global vehicular network diagram template
UML Component Diagram

Simple & Fast Diagram Software


JSD - Jackson system development

"Classic TQM Tools ...
Flow Charts Pictures, symbols or text coupled with lines, arrows on lines show direction of flow. Flowcharting enables
modeling of processes; problems/ opportunities and decision points etc. It develops a common understanding of a process by those in
volved." [whaqualitycenter.org/ Portals/ 0/ Tools%20 to%20 Use/ Classic%20 Quality%20 Tools/ Classic%20 TQM%20 Tools%20 R%20 2-12.pdf]
The vector stencils library TQM diagrams contains 58 symbols for drawing total quality management (TQM) flow charts using the ConceptDraw PRO diagramming and vector drawing software.
The example "Design elements - TQM diagram" is included in the Total Quality Management (TQM) Diagrams solution from the Quality area of ConceptDraw Solution Park.
TQM flow chart symbols

Transportation Infographics

How To Create a Workflow Diagram

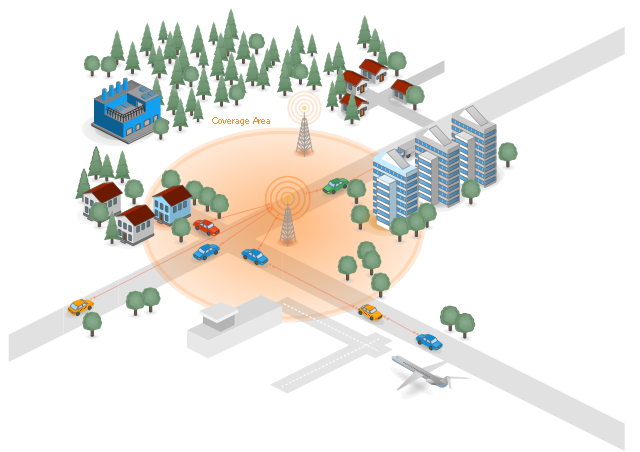
This network diagram sample depicts the cooperative delay-tolerant vehicular communication system.
"Vehicular Communication Systems are an emerging type of networks in which vehicles and roadside units are the communicating nodes; providing each other with information, such as safety warnings and traffic information. As a cooperative approach, vehicular communication systems can be more effective in avoiding accidents and traffic congestions than if each vehicle tries to solve these problems individually.
Generally vehicular networks are considered to contain two types of nodes; vehicles and roadside stations. Both are Dedicated Short Range Communications (DSRC) devices. DSRC works in 5.9 GHz band with bandwidth of 75 MHz and approximate range of 1000m. The network should support both private data communications and public (mainly safety) communications but higher priority is given to public communications. Vehicular communications is usually developed as a part of Intelligent Transport Systems (ITS). ITS seeks to achieve safety and productivity through intelligent transportation which integrates communication between mobile and fixed nodes. To this end ITS heavily relies on wired and wireless communications." [Vehicular communication systems. Wikipedia]
The diagram example "Cooperative vehicular delay-tolerant network" was created using the ConceptDraw PRO diagramming and vector drawing software extended with the Vehicular Networking solution from the Computer and Networks area of ConceptDraw Solution Park.
Vehicular communication system diagram
Presenting Documents with Remote Presentation for Skype Solution

Credit Card Processing System UML Diagram

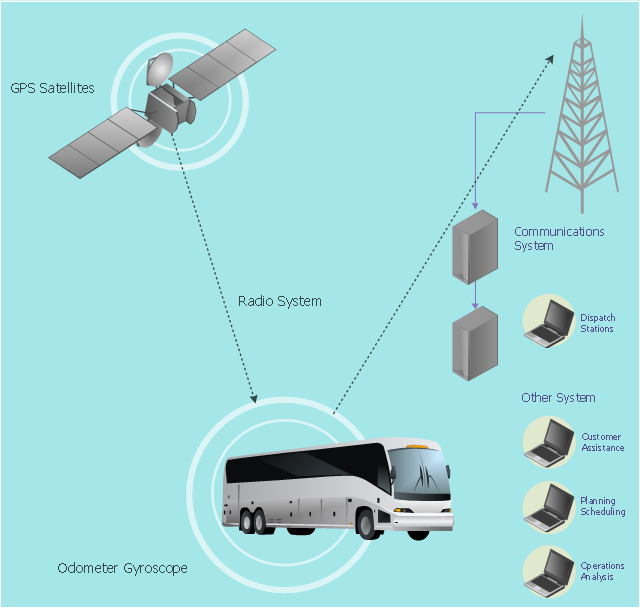
This vehicular network diagram example was drawn on the base of picture illustrating the article "Automatic Vehicle Location: Rural Transit" from the website of the Research and Innovative Technology Administration (RITA), U.S. Department of Transportation (US DOT).
"Automatic Vehicle Location (AVL) systems calculate the real-time location of any vehicle equipped with a Global Positioning Satellite (GPS) receiver. Data are then transmitted to the transit center with use of radio or cellular communications and can be used immediately for daily operations as well as archived for further analysis.
As a stand-alone technology, an AVL system can be used to monitor on-time performance. When combined with other technologies, AVL can deliver many benefits in the areas of fleet management, service planning, safety and security, traveler information, fare payment, vehicle component monitoring, and data collection. Since the greatest benefits from AVL are achieved by combining it with other Intelligent Transportation System (ITS) technologies, AVL is most appropriate for large rural agencies with more than 30 vehicles that plan to implement a comprehensive ITS."
[pcb.its.dot.gov/ factsheets/ avl/ avlRural_ overview.asp]
The vehicular network diagram example "Automatic vehicle location" was created using the ConceptDraw PRO diagramming and vector drawing software extended with the Vehicular Networking solution from the Computer and Networks area of ConceptDraw Solution Park.
Vehicular network diagram
Used Solutions
Spatial infographics Design Elements: Transport Map

- UML Class Diagram Example for Transport System | Flowchart ...
- Example Of Use Case Diagram In Transportation System
- Class Diagram For Transport System Bus Depo
- UML Class Diagram Example for Transport System
- Transportation System In Database System Er Diagram
- UML Class Diagram Example for Transport System
- UML Class Diagram Example for Transport System
- Domain Diagram For Transport Management System
- About Sequence Diagram For Transport System
- Intelligent transportation system | Fault Tree Analysis Diagrams ...
- Intelligent transportation system | Entity-Relationship Diagram (ERD ...
- Intelligent transportation system | Global vehicular network diagram ...
- Activity Diagram For Transportation System
- Activity Diagram For Transport Management System
- Class Diagram For Air Transportation System
- How Can We Draw Of Deployment Diagram For Transport System
- UML Class Diagram Example for Transport System | Brilliant ...
- UML Class Diagram Example for GoodsTransportation System ...
- UML Class Diagram Example for Transport System | Design ...