 Event-driven Process Chain Diagrams
Event-driven Process Chain (EPC) Diagram is a type of flowchart widely used for modeling in business engineering and reengineering, business process improvement, and analysis. EPC method was developed within the Architecture of Integrated Information Systems (ARIS) framework.
Basic Flowchart Symbols and Meaning


HelpDesk
Event-driven Process Chain (EPC) Diagram Software

 Total Quality Management TQM Diagrams
Total Quality Management Diagrams solution extends ConceptDraw PRO software with samples, templates and vector stencils library for drawing the TQM flowcharts.
Create Block Diagram

The Best Tool for Business Process Modeling
Diagram. Login and Registration Processing Sample")
Types of Flowcharts


An Event-driven Process Chain (EPC) - flowchart used for business process modelling
 flowchart used for business process modelling")
 ConceptDraw Solution Park
ConceptDraw Solution Park collects graphic extensions, examples and learning materials
 Pie Charts
Pie Charts are extensively used in statistics and business for explaining data and work results, in mass media for comparison (i.e. to visualize the percentage for the parts of one total), and in many other fields. The Pie Charts solution for ConceptDraw PRO v10 offers powerful drawing tools, varied templates, samples, and a library of vector stencils for simple construction and design of Pie Charts, Donut Chart, and Pie Graph Worksheets.
 Audit Flowcharts
Audit flowcharts solution extends ConceptDraw PRO software with templates, samples and library of vector stencils for drawing the audit and fiscal flow charts.
 Flowcharts
The Flowcharts solution for ConceptDraw PRO is a comprehensive set of examples and samples in several varied color themes for professionals that need to represent graphically a process. Solution value is added by the basic flow chart template and shapes' libraries of flowchart notation. ConceptDraw PRO flow chart creator lets one depict the processes of any complexity and length, as well as design the Flowchart either vertically or horizontally.
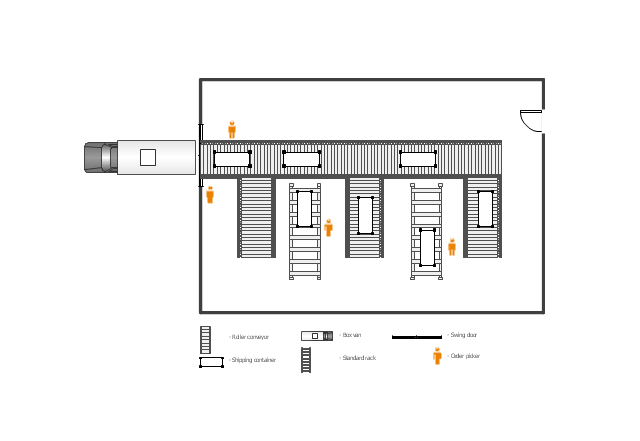
This floor plan example was drawn on the base of slide 27 "Warehouse Layout Floor Plan" of the presentation "Operations Management. Layout Strategy. Chapter 9" from the website of the School of Business Administration at Portland State University. [sba.pdx.edu/ faculty/ karlt/ Ch9/ sld027.htm]
"A conveyor system is a common piece of mechanical handling equipment that moves materials from one location to another. Conveyors are especially useful in applications involving the transportation of heavy or bulky materials. Conveyor systems allow quick and efficient transportation for a wide variety of materials, which make them very popular in the material handling and packaging industries. Many kinds of conveying systems are available, and are used according to the various needs of different industries. There are chain conveyors (floor and overhead) as well. Chain conveyors consist of enclosed tracks, I-Beam, towline, power & free, and hand pushed trolleys." [Conveyor system. Wikipedia]
The floor plan example "Warehouse with conveyor system" was created using the ConceptDraw PRO diagramming and vector drawing software extended with the Plant Layout Plans solution from the Building Plans area of ConceptDraw Solution Park.
Floor plan - Warehouse with conveyor system
 PM Presentations
The PM Presentations solution extends the power of ConceptDraw MINDMAP, ConceptDraw PRO, and ConceptDraw PROJECT, improving their efficiency at many stages of the project management process by using the same source data to construct the targeted presentation for your audience and clearly communicating the appropriate information to different audiences from a single source. It gives an ability to project managers and other team participants to create and to deliver capacious presentations representing the data and knowledge of a specific project with the help of including visual dashboards, Gantt charts, resource views, maps, timelines, calendars, illustrations, project diagrams and reports of varied types. Having the possibility to edit collaboratively in a Full-Screen Mode, the teams can rapidly plan a project as well as execute the tasks of revising and making changes to it.
- Chain Management System
- Supply Chain Management It Systems
- Supply Chain Management Business Processes
- How To Make Dfd Diagram Of Supplier Chain Management
- Total Quality Management Definition | How to Create an IDEF0 ...
- Sequence Diagrams For Restaurant Management System
- Process Flowchart | Total Quality Management Definition | Plumbing ...
- Use Case Diagram For Library Management System Visio
- Fuctional Block Diagram Of Event Management System
- Event-driven Process Chain Diagrams EPC | Structured Systems ...
- Advanced persistent threat lifecycle | Total Quality Management ...
- Supply Chain Management What Is It
- News Management System Data Flow Diagram
- Use Case Diagram For Credit Card Management System
- Total Quality Management Definition | How to Create an IDEF0 ...
- Process Flowchart | How to Create Flowcharts for an Accounting ...
- Dfd Diagram For Event Management System
- Online Event Management System For Data Flow Diagram Examples
- Entity-Relationship Diagram (ERD) | Event-driven Process Chain ...