 Scatter Diagrams
The Scatter Diagrams solution extends ConceptDraw PRO v10 functionality with templates, samples, and a library of vector stencils that make construction of a Scatter Plot easy. The Scatter Chart Solution makes it easy to design attractive Scatter Diagrams used in various fields of science, work, and life activities. ConceptDraw PRO lets you enter the data to the table and construct the Scatter Plot Graph automatically according to these data.
Seven Basic Tools of Quality — Quality Control

Seven Basic Tools of Quality - Fishbone Diagram

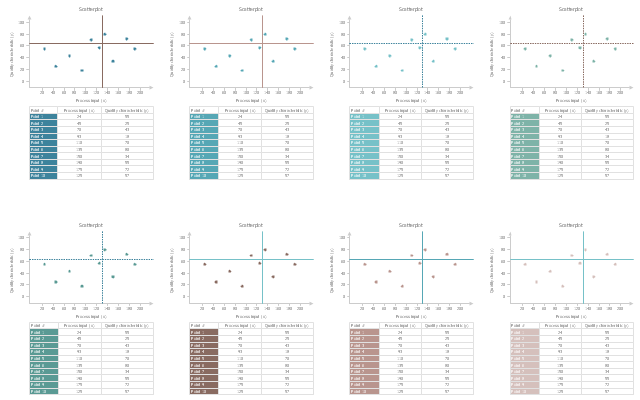
The vector stencils library "Scatterplot" contains 8 scatter diagram templates.
Use to design your scatter graphs with ConceptDraw PRO diagramming and vector drawing software.
"A scatter plot, scatterplot, or scattergraph is a type of mathematical diagram using Cartesian coordinates to display values for typically two variables for a set of data. If the points are color-coded you can increase the number of displayed variables to three.
The data is displayed as a collection of points, each having the value of one variable determining the position on the horizontal axis and the value of the other variable determining the position on the vertical axis. This kind of plot is also called a scatter chart, scattergram, scatter diagram, or scatter graph. ...
The scatter diagram is one of the seven basic tools of quality control." [Scatter plot. Wikipedia]
The example of scatter chart templates "Design elements - Scatterplot" is included in the Seven Basic Tools of Quality solution from the Quality area of ConceptDraw Solution Park.
Scatter graph templates
Total Quality Management Value

Line Chart Examples

 Total Quality Management TQM Diagrams
Total Quality Management Diagrams solution extends ConceptDraw PRO software with samples, templates and vector stencils library for drawing the TQM flowcharts.
Competitor Analysis

Seven Basic Tools of Quality - Flow Chart

 Fishbone Diagrams
The Fishbone Diagrams solution extends ConceptDraw PRO v10 software with the ability to easily draw the Fishbone Diagrams (Ishikawa Diagrams) to clearly see the cause and effect analysis and also problem solving. The vector graphic diagrams produced using this solution can be used in whitepapers, presentations, datasheets, posters, and published technical material.
Scatter Graph

Scatter Chart Examples

 Seven Basic Tools of Quality
Manage quality control in the workplace, using fishbone diagrams, flowcharts, Pareto charts and histograms, provided by the Seven Basic Tools of Quality solution.
Visual Presentations Made Easy with Diagramming Software


Scatter Plot

- Scatter Diagrams | Seven Basic Tools of Quality - Quality Control ...
- Scatter Diagram In Total Quality Management
- Scatter Diagrams | Pyramid Diagram | Total Quality Management ...
- Seven Basic Tools of Quality - Quality Control | Scatter Diagrams ...
- Scatter Diagram In Tqm
- Scatter Diagrams | Total Quality Management TQM Diagrams | Basic ...
- Total Quality Management TQM Diagrams | Visual Presentations ...
- Scatter Diagrams | Blank Scatter Plot | How to Draw a Scatter ...
- Stratification And Scatter Diagram
- Scatter Chart Examples | Scatter Diagrams | How to Draw a Scatter ...
- Scatter Diagrams | Scatter Chart Examples | Blank Scatter Plot ...
- Using A Scatter Plot For Quality Control Electrical Engineering
- Blank Scatter Plot | Probability Quality Control Tools | Workflow ...
- Scatter Diagrams | Scatter Chart Examples | Scatter Diagram ...
- Scatter Plot | Blank Scatter Plot | Design elements - Scatterplot ...
- Scatter Graph Charting Software | Scatter Chart Examples | Scatter ...
- Scatter Chart Examples | Scatter graph - Template | Scatter graphs ...
- Scatter Chart Examples | Design elements - Scatterplot | Design ...
- Scatter Chart Examples | Scatter Graph | Blank Scatter Plot ...
- Scatter Diagrams | Scatter Graph | Scatter Graph Charting Software ...