Infographic software: the sample of New York City Subway map

How to draw Metro Map style infographics? (London)

Subway infographic design elements - software tools

Baseball Diagram – Baseball Field – Corner View – Sample

Map Infographic Design

Excellent Examples of Infographic Maps

Best Tool for Infographic Construction

How to Create a Powerful Infographic When You do not Have a Designer

Spatial infographics Design Elements: Location Map

HelpDesk
How to Use ConceptDraw Infographic in Presentations, Documents, and Publications

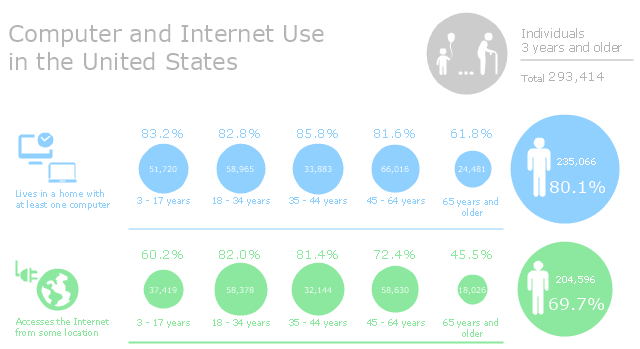
This infographic sample was created on the base of "Computer and Internet Use in the United States. Population Characteristics. Thom File. Issued May 2013." from the website of U.S. Census Bureau (U.S. Department of Commerce. Economics and Statistics Administration). [census.gov/ prod/ 2013pubs/ p20-569.pdf]
The infogram example "Computer and Internet Use in the United States" was created using the ConceptDraw PRO diagramming and vector drawing software extended with the Pictorial Infographic solition from the area "What is infographics" in ConceptDraw Solution Park.
The infogram example "Computer and Internet Use in the United States" was created using the ConceptDraw PRO diagramming and vector drawing software extended with the Pictorial Infographic solition from the area "What is infographics" in ConceptDraw Solution Park.
Pictorial infogram
Defensive Play Diagram – Under Front

Baseball Field Sample

Simple Baseball Field – Sample

 Spatial Infographics
Spatial infographics solution extends ConceptDraw PRO software with infographic samples, map templates and vector stencils libraries with design elements for drawing spatial information graphics.
Winter Sports. Olympic Games Infographics. Medal Table

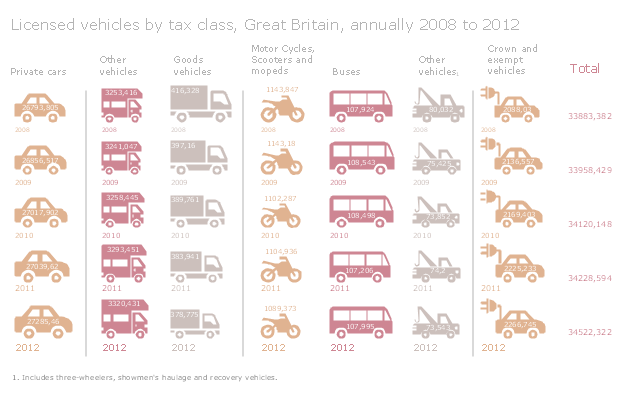
This infographic sample was created on the base of "Transport Statistics Great Britain 2013" from the website of UK Department for Transport. [gov.uk/ government/ publications/ transport-statistics-great-britain-2013]
The infographics example "Licensed vehicles by tax class, Great Britain, annually: 2008 to 2012" was created using the ConceptDraw PRO diagramming and vector drawing software extended with the Pictorial Infographic solition from the area "What is infographics" in ConceptDraw Solution Park.
The infographics example "Licensed vehicles by tax class, Great Britain, annually: 2008 to 2012" was created using the ConceptDraw PRO diagramming and vector drawing software extended with the Pictorial Infographic solition from the area "What is infographics" in ConceptDraw Solution Park.
Pictorial infogram
Winter Sports Vector Clipart. Medal Map. Spatial Infographics

Sample Pictorial Chart. Sample Infographics
")
Use Pictorial Infographics solution to draw your own design pictorial infographics documents quick and easy.
- Subway infographic design elements - software tools | Infographic ...
- Infographic software: the sample of New York City Subway map ...
- Infographic software: the sample of New York City Subway map ...
- Infographic design elements, software tools Subway and Metro style ...
- How to draw Metro Map style infographics? (London) | Infographic ...
- Chemistry | ConceptDraw Solution Park | Universal Diagramming ...
- Infographic design elements, software tools Subway and Metro style ...
- Geo Map - USA - New York | Infographic software: the sample of ...
- Infographic design elements, software tools Subway and Metro style ...
- Map Infographic Design
- Transportation Infographics | Spatial infographics Design Elements ...
- Best Tool for Infographic Construction | Map Infographic Creator ...
- How to Create a Powerful Infographic When You do not Have a ...
- Map Infographic Tool | Map Infographic Creator | Map Infographic ...
- Illustration Area | Audio and Video Connectors | Infographic design ...
- How to draw Metro Map style infographics? (London) | Metro Map ...
- How to draw Metro Map style infographics? (New York) | Subway ...
- Map Infographic Creator | How to draw Metro Map style infographics ...
- How to draw Metro Map style infographics? (London) | Map ...
- Map Infographic Creator | Spatial infographics Design Elements ...