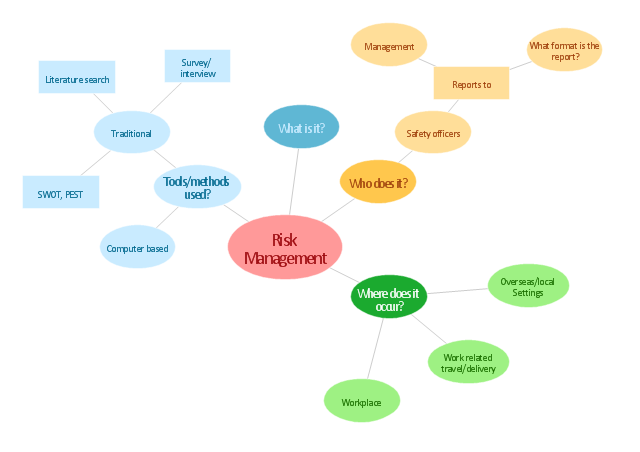
"Risk management is the identification, assessment, and prioritization of risks (defined in ISO 31000 as the effect of uncertainty on objectives, whether positive or negative) followed by coordinated and economical application of resources to minimize, monitor, and control the probability and/ or impact of unfortunate events or to maximize the realization of opportunities. Risks can come from uncertainty in financial markets, threats from project failures (at any phase in design, development, production, or sustainment life-cycles), legal liabilities, credit risk, accidents, natural causes and disasters as well as deliberate attack from an adversary, or events of uncertain or unpredictable root-cause. ... Methods, definitions and goals vary widely according to whether the risk management method is in the context of project management, security, engineering, industrial processes, financial portfolios, actuarial assessments, or public health and safety.
The strategies to manage threats (uncertainties with negative consequences) typically include transferring the threat to another party, avoiding the threat, reducing the negative effect or probability of the threat, or even accepting some or all of the potential or actual consequences of a particular threat, and the opposites for opportunities (uncertain future states with benefits)." [Risk management. Wikipedia]
The concept map example "Risk management" was created using the ConceptDraw PRO diagramming and vector drawing software extended with the Concept Maps solution from the area "What is a Diagram" of ConceptDraw Solution Park.
Concept map
The vector stencils library "Management pictograms" contains 72 management pictograms.
Use it to create your management infogram in the ConceptDraw PRO diagramming and vector drawing software.
The flat icons example "Management pictograms - Vector stencils library" is included in the solution "Marketing infographics" from the "Business infographics" area of ConceptDraw Solution Park.
Use it to create your management infogram in the ConceptDraw PRO diagramming and vector drawing software.
The flat icons example "Management pictograms - Vector stencils library" is included in the solution "Marketing infographics" from the "Business infographics" area of ConceptDraw Solution Park.
Accounting management

Activity

Audit management

Board of directors

Budget

Business managemen

Business management tools

Business model

Commanding

Communication

Company

Contract management

Controlling

Coordinating

Core competencies

Corporate strategy

Creativity

Crisis management

Crisis management 2

Decision making

Environmental management

Expenses

External environment

Financial management

Financial management 2

Financial planning

First-level manager

Goal

HR management

Investment management

IT management

Knowledge management

Knowledge management 2

Leadership

Macro environment

Management system

Managerial accounting

Manufacturing management

Market orientation

Marketing management

Marketing strategy

Middle-level manager

Mission

Objectives

Operations management

Organizing

Performance

Performance management

Planning

Policy

PR management

Problem solving

Process management

Product management

Profit

Profit 2

Project management

Quality management

Research and development

Resource management

Resources

Risk management

Sales manegment

Service management

Stakeholder management

Strategic management

Strategic planning

Technology management

Time frame

Time management

Top-level manager

Vision

Remote Projects in Corporate Strategy


PDPC

Sales Process Flowchart Symbols

Internal Audit Process

Competitor Analysis

CORRECTIVE ACTIONS PLANNING. Risk Diagram (PDPC)
 *")

SWOT Matrix Template

Stakeholder Management System

Human Resource Management

The Action Plan

Risk Diagram (Process Decision Program Chart)
 *")
 Enterprise Architecture Diagrams
Enterprise Architecture Diagrams solution extends ConceptDraw DIAGRAM software with templates, samples and library of vector stencils for drawing the diagrams of enterprise architecture models.
Strategy Map

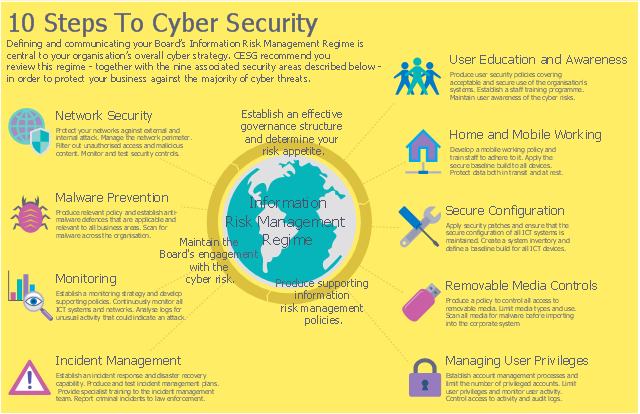
This example was designed on the base of the cybersecurity infographic from the website gov.uk. (Open Government Licence v3.0. nationalarchives.gov.uk/ doc/ open-government-licence/ version/ 3/ )
"10 Steps To Cyber Security...
Defining and communicating your Board’s Information Risk Management Regime (shown at the centre of the following diagram) is central to your organisation’s overall cyber strategy.
... the 9 steps that surround it are ...
- Secure configuration
- Network security
- Managing user privileges
- User education and awareness
- Incident management
- Malware prevention
- Monitoring
- Removable media controls
- Home and mobile working" [gov.uk/ government/ publications/ cyber-risk-management-a-board-level-responsibility/ 10-steps-summary]
The infographic example "10 Steps to Cyber Security" was created using the ConceprDraw PRO software extended with the Network Security Diagrams solution from the Computer and Neworks area of ConceptDraw Solution Park.
Computer security infographic
Used Solutions
SWOT Analysis matrix templates and samples

Decision Making

Marketing Analysis Diagram

- Sample Risk Management Plan Template Chart
- Block Diagram Of Risk Management
- Concept Map About Risk Reduction
- Process decision program chart (PDPC) - Personal activity ...
- Balanced scorecard strategy map | MindWave for SAP Streamworks ...
- Risk management - Concept map | How To Make a Concept Map ...
- Remote Projects in Corporate Strategy | Build Strategies ...
- Strategic Management
- Risk management - Concept map | Types of Flowchart - Overview ...
- Risk management - Concept map | Concept Maps | Cross ...
- The Best Flowchart Software Available | Risk management ...
- Concept Map Of Management
- Risk management - Concept map | Concept Map In Liabilities
- Management - Design Elements | Management pictograms - Vector ...
- How To Implement Collaborative Project Management | SWOT ...
- Accounting Flowcharts | Managerial Accounting Mind Map
- Vector Diagram Of Strategic Management
- Risk management - Concept map | What Is an Action Mind Map ...
- How To Make a Concept Map | The Best Flowchart Software ...