How to Create Presentation of Your Project Gantt Chart
During the planning, discussing and execution of a project you may need to prepare a presentation using project views such as the Gantt Chart, Multiproject Dashboard or Resource Usage View. It’s easy do with ConceptDraw PROJECT!Sales Dashboard - insight about potential opportunities and key sales operations
ConceptDraw Sales Dashboard gives you a clear insight about potential opportunities and key sales operations. Analysing sales KPI is a proven way to see how your business can improve.Sales Dashboards for Your Company
ConceptDraw DIAGRAM software extended with the Sales Dashboard solution allows you produce sales dashboards for your company easily. You can start from samples and templates delivered with the solution and then modify them to get a dashboard that suites your specific needs.How To Do A Mind Map In PowerPoint
ConceptDraw MINDMAP - an excellent tool for exporting mind maps to PowerPoint to visualize and presenting your project. You can simply generate, change, update your mindmap and then make a presentation in PowerPoint.Sales Teams are Inherently Competitive
Sales teams are inherently competitive, so you don't need to invent extra ways to stimulate the competition. At the same time, you can provide the team with a sales dashboard shows company, team and personal KPI to make the competition clear.
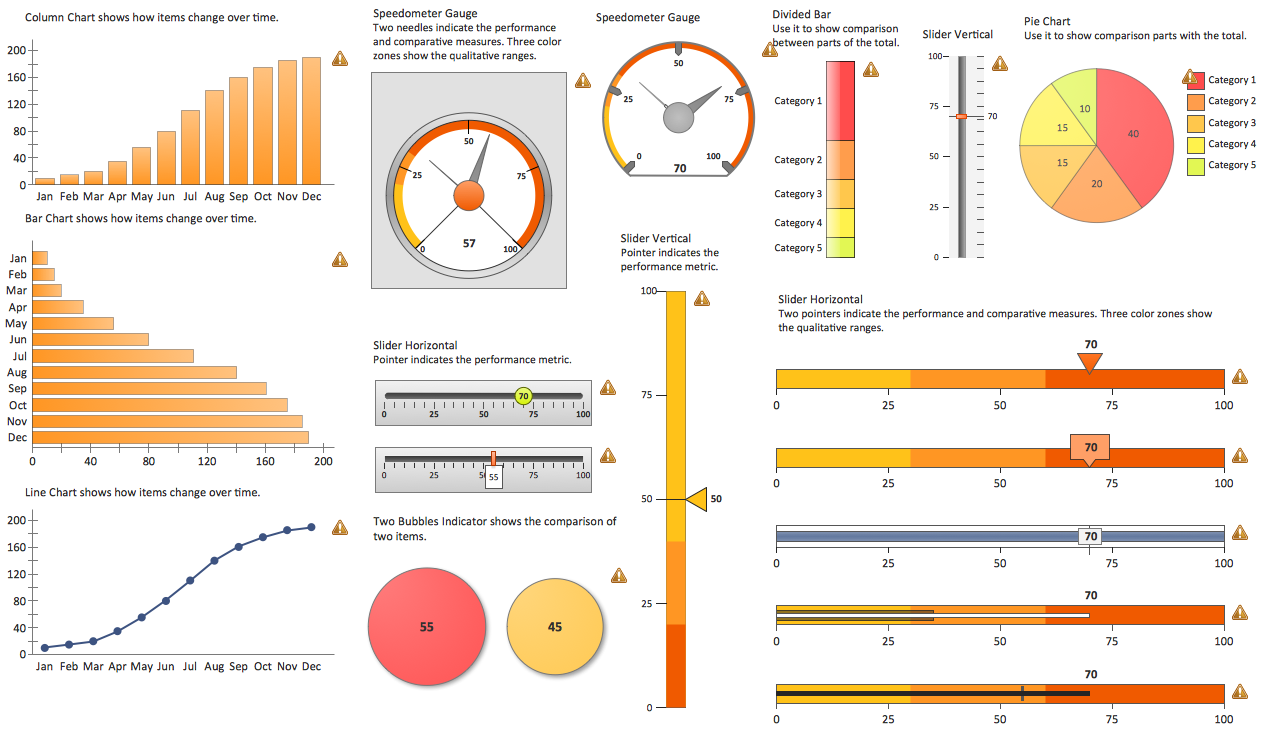
Business Intelligence Dashboard Software
ConceptDraw DIAGRAM is a business intelligence dashboard software that allows you produce sales dashboard that suites your specific needs. To see how your business can improve with sales dashboards select KPI and start tracking it.Lean Six Sigma Diagram Software
Lean Six Sigma (LSS) is a well-known in all over the world methodology of quality improvement and business perfection. ConceptDraw DIAGRAM diagramming and vector drawing software is a powerful Lean Six Sigma Diagram Software thanks to the included Value Stream Mapping solution from the Quality Management Area of ConceptDraw Solution Park.
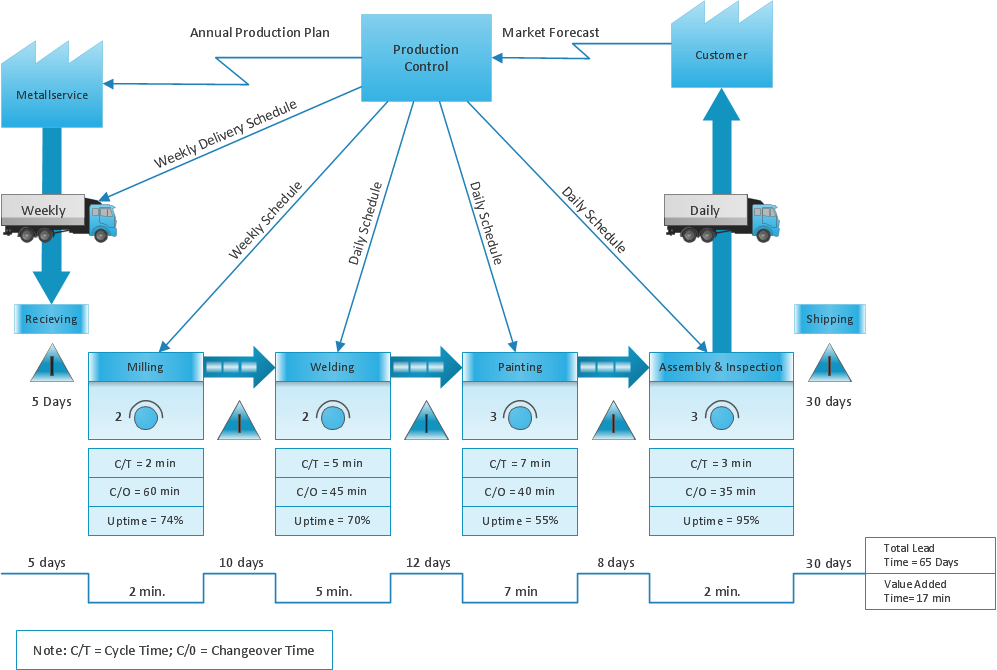
Value Stream Analysis
ConceptDraw Value Stream Maps are used in lean practice for analysis of manufacturing processes to identify the improvement opportunities.PROBLEM ANALYSIS. Identify and Structure Factors
Identify and Structure Factors. Use the Affinity Diagram to collect and structure factors that impact on a problem.ConceptDraw OFFICE suite is a software for identify and structure factors with affinity diagram. This is a grouping and structuring of factors that impact on a problem.
Successful Strategic Plan
This sample shows the Strategic Plan of the Broadband Lifecycle that was developed by Strategic Networks Group. The Broadband Lifecycle represents the advance of the broadband investments.Lean Value Stream Map
Lean Manufacturing tool is a new Value Stream Mapping solution found in the ConceptDraw Solution Park.SWOT Analysis Software
SWOT Analysis solution from ConceptDraw Solution Park contains easy-to-use mind map templates that help identify Strengths, Weaknesses, Opportunities, and Threats using ConceptDraw MINDMAP software, as well as outputs to ConceptDraw DIAGRAM for presenting analysis results as SWOT and TOWS matrices.Value Stream Mapping and Analysis
Value Stream Maps are used in lean methodology for analysis of manufacturing process and identification of the improvement opportunities.
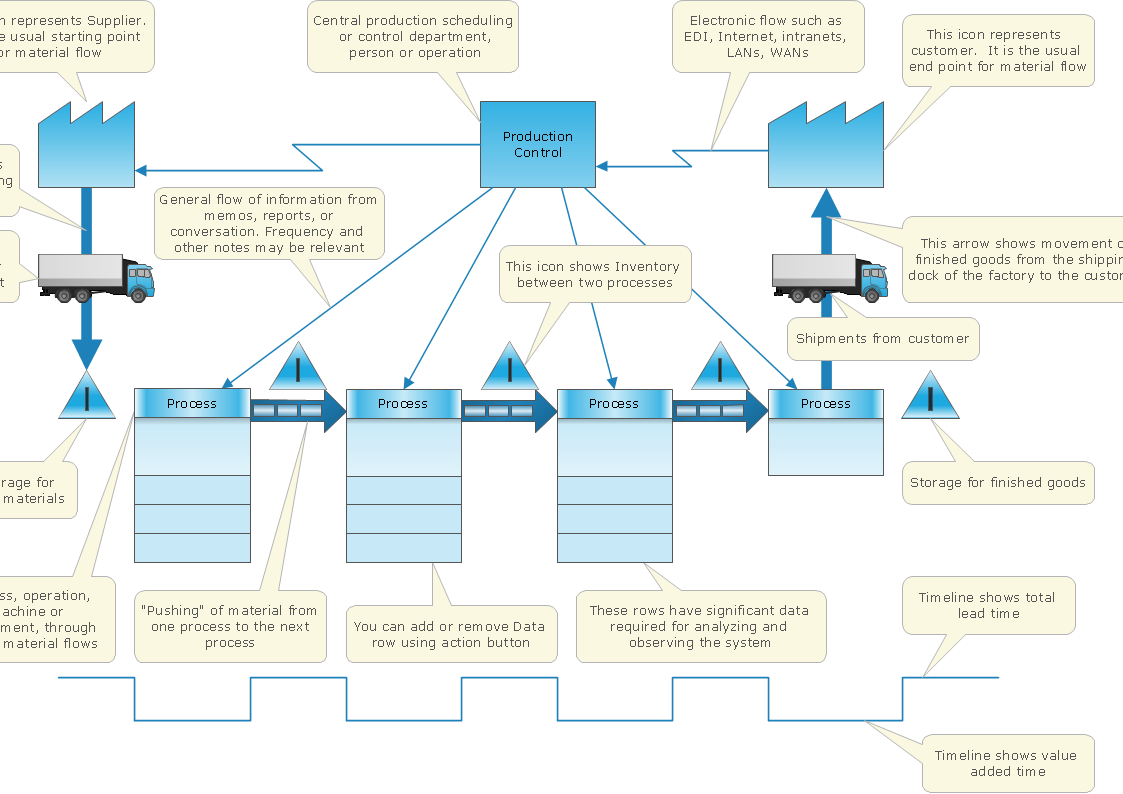
The Lean Enterprise Value Stream Mapping
Create value stream maps - for value stream analysis and value stream management, material and information flow mapping, using our quick start templates included with ConceptDraw.
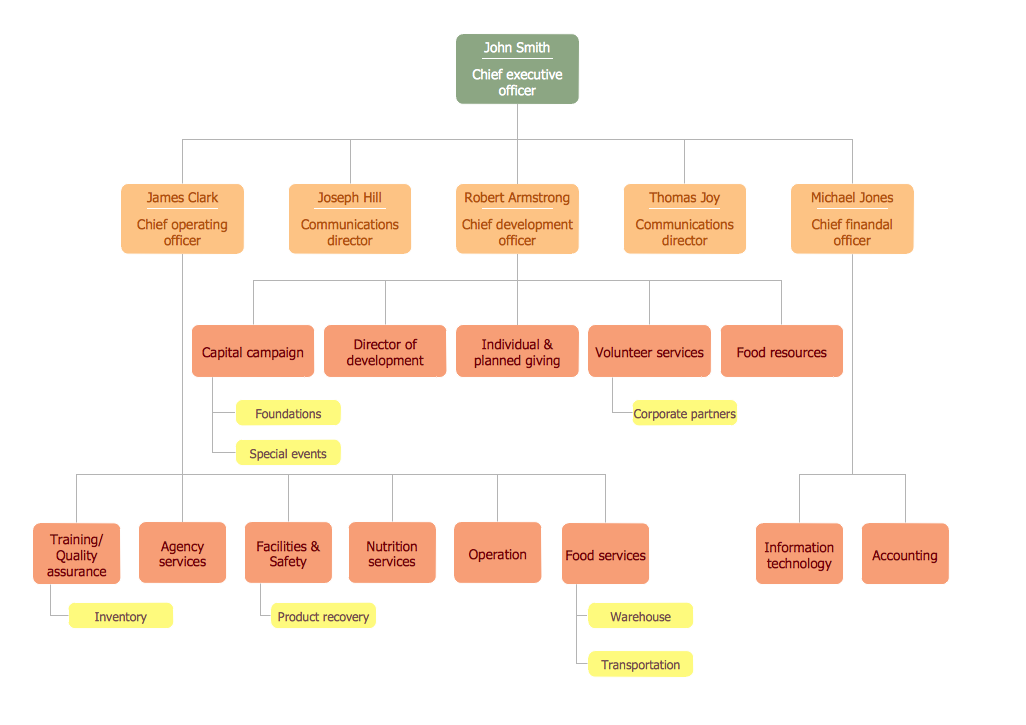
Organigrams with ConceptDraw DIAGRAM
ConceptDraw - Organigram software allows quickly create Organigrams and much more. ConceptDraw DIAGRAM is an ideal tool for Administrative staff to clearly demonstrate the company orgchart professional.- Marketing Pic Png
- Pictures of Graphs | Pictures of Vegetables | Pictures of Food | Pict ...
- Conceptdraw Com How To Guide Picture Campus Area Network Png
- Raw Material Drawing Images
- Accountancy Business Management Clip Art Png
- Pics Of Populations Bar Graphs
- Presentation Pic
- Process Flowchart Png
- Computer Pictures
- Images Of Network Topologies
- Images Of Networking Topology
- Transport Pictures
- Images Of Telecommunication
- Business People Figures | Business - Design Elements | Marketing ...
- How to Design a Fast-Food Restaurant Menu Using ConceptDraw ...
- Total Quality Management Value | What is Value Stream Mapping ...
- Fully Connected Network Topology Diagram | How to Create SWOT ...
- Final object schematic - IDEF3 diagram | Vector stencils library ...
- Business Process Reengineering Examples | BPR Diagram ...
- Workflow diagram - Weather forecast | How can you illustrate the ...
- ERD | Entity Relationship Diagrams, ERD Software for Mac and Win
- Flowchart | Basic Flowchart Symbols and Meaning
- Flowchart | Flowchart Design - Symbols, Shapes, Stencils and Icons
- Flowchart | Flow Chart Symbols
- Electrical | Electrical Drawing - Wiring and Circuits Schematics
- Flowchart | Common Flowchart Symbols