Pictures of Graphs

Picture Graph

 Picture Graphs
Typically, a Picture Graph has very broad usage. They many times used successfully in marketing, management, and manufacturing. The Picture Graphs Solution extends the capabilities of ConceptDraw PRO v10 with templates, samples, and a library of professionally developed vector stencils for designing Picture Graphs.
Geo Map - Asia

Use Geo Map Asia to draw thematic maps, geospatial infographics and vector illustrations for your business documents, presentations and websites.
What Is a Line Chart

Geo Map - Europe - Belarus

Line Chart Template for Word

This sample shows the Line Chart of annual percentage change. The Line Chart allows you to clearly see the changes of data over the time.
Blank Scatter Plot

How to Create a Line Chart

Geo Map - Africa
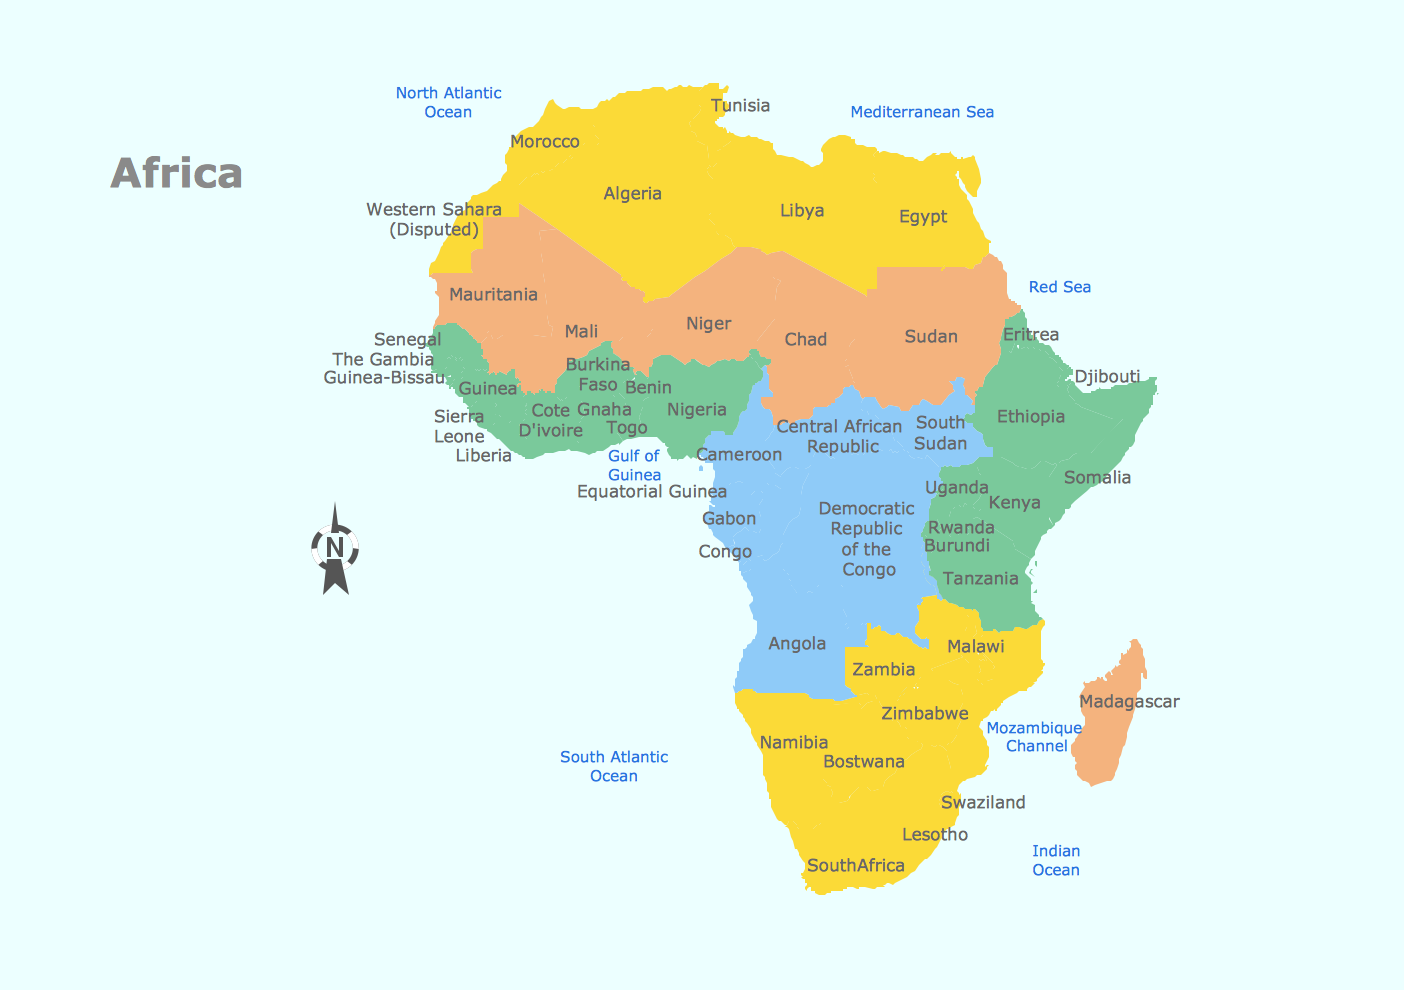
Vector design elements library Africa contains country map contours, geographical maps, cartograms and thematic maps for ConceptDraw PRO diagramming and vector drawing software. To help visualize the business and thematic information connected with geographic areas, locations or customs.
All ConceptDraw PRO documents are vector graphic files and are available for reviewing, modifying, and converting to a variety of formats: image, HTML, PDF file, MS PowerPoint Presentation, Adobe Flash, MS Visio (.VDX, .VSDX).
Chart Templates

Competitor Analysis

- Barrie population - Picture bar graph | Picture Graph | Sales Growth ...
- Picture Graph
- Barrie population - Picture bar graph | Line Graph | Picture Graph ...
- Pictures of Graphs | Picture Graph | Basic Diagramming | Bar Graph ...
- Basic Diagramming | Sales Growth. Bar Graphs Example | Pictures ...
- Picture Graphs | How to Create a Picture Graph in ConceptDraw ...
- Barrie population - Picture bar graph | Design elements - Picture ...
- Barrie population - Picture bar graph | Basic Diagramming | Line ...
- Bar Graphs | Line Graphs | Sales Growth. Bar Graphs Example ...
- Examples Of Bar Graph In Population
- Basic Diagramming | Picture Graph | Pictures of Graphs | Population ...
- Bar Graph Of Population Growth Rate
- Picture Graph | Geo Map - Africa | Geo Map - Europe - Austria | Pics ...
- Pictures of Graphs | Population growth by continent, 2010 - 2013 ...
- Picture Graph | Sales Growth. Bar Graphs Example | Line Graph ...
- Picture Graphs | How to Create a Picture Graph in ConceptDraw ...
- Picture Graphs | Picture graphs - Vector stencils library | Picture ...
- Pictures of Graphs | Line Graph | Picture Graph | Diagram On ...
- Line Chart Examples | Pictures of Graphs | Line Graph | Population ...