Influence Diagram

Influence Diagram Software

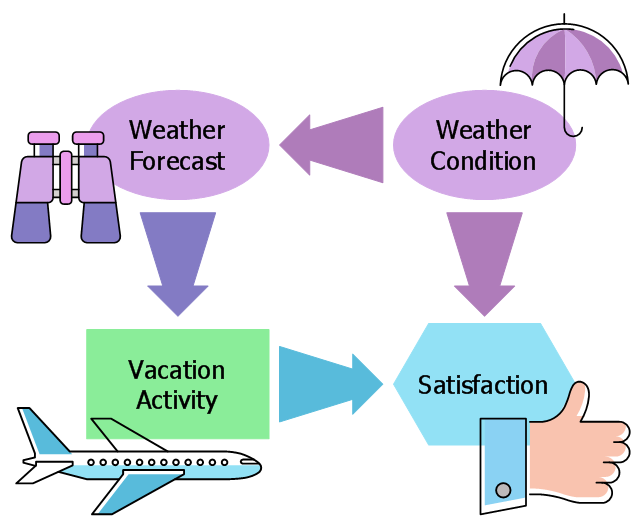
This decision diagram example was designed on the base of the Wikimedia Commons file: Simple Influence Diagram.svg.
[commons.wikimedia.org/ wiki/ File:Simple_ Influence_ Diagram.svg]
This file is made available under the Creative Commons CC0 1.0 Universal Public Domain Dedication. [creativecommons.org/ publicdomain/ zero/ 1.0/ deed.en]
"An influence diagram (ID) (also called a relevance diagram, decision diagram or a decision network) is a compact graphical and mathematical representation of a decision situation. It is a generalization of a Bayesian network, in which not only probabilistic inference problems but also decision making problems (following the maximum expected utility criterion) can be modeled and solved.
ID was first developed in the mid-1970s by decision analysts with an intuitive semantic that is easy to understand. It is now adopted widely and becoming an alternative to the decision tree which typically suffers from exponential growth in number of branches with each variable modeled. ID is directly applicable in team decision analysis, since it allows incomplete sharing of information among team members to be modeled and solved explicitly. Extensions of ID also find their use in game theory as an alternative representation of the game tree." [Influence diagram. Wikipedia]
The example "Influence diagram" was designed using ConceptDraw software extended with Decision Making solution from Management area of ConceptDraw Solution Park.
Decision diagram example
Cause and Effect Analysis


Basic Network Diagram


Leadership Training Influence

, t chart, decision matrix, decision tree analysis") Decision Making
Decision Making
The Decision Making solution offers the set of professionally developed examples, powerful drawing tools and a wide range of libraries with specific ready-made vector decision icons, decision pictograms, decision flowchart elements, decision tree icons, decision signs arrows, and callouts, allowing the decision maker (even without drawing and design skills) to easily construct Decision diagrams, Business decision maps, Decision flowcharts, Decision trees, Decision matrix, T Chart, Influence diagrams, which are powerful in questions of decision making, holding decision tree analysis and Analytic Hierarchy Process (AHP), visual decomposition the decision problem into hierarchy of easily comprehensible sub-problems and solving them without any efforts.
CORRECTIVE ACTIONS PLANNING. Risk Diagram (PDPC)
 *")
Functional Block Diagram

Electrical Diagram Software


Types of Flowcharts


Decision Tree Analysis

The ConceptDraw DIAGRAM diagramming and drawing software is the one that can help with creating the needed drawing, including a decision tree. Making decision tree analysis, it is always easy to make the needed matrix as there are plenty of pre-made templates to be used.
Samples of Flowchart

Powerful Drawing Feature for Creating Professional Diagrams

How to Draw Business Process Diagrams with RapidDraw Interface

Sales Process Steps

Activity on Node Network Diagramming Tool

How to Design Landscape

Notation & Symbols for ERD

 Management Area
The solutions from Management area of ConceptDraw Solution Park collect templates, samples and libraries of vector stencils for drawing the management diagrams and mind maps.
- Marketing Charts | Influence Diagram | Cause and Effect Analysis ...
- Influence Diagram | ConceptDraw Arrows10 Technology ...
- Influence Diagram | Influence Diagram Software | SDL Diagram ...
- Influence Chart Excel
- Influence Diagram | Influence Diagram Software | Circle-Spoke ...
- MS Visio Look a Like Diagrams | Influence Diagram Software
- Process Flowchart | Influence Diagram | Interaction Overview ...
- Decision Making | Decision tree | Influence Diagram | Decision ...
- Marketing Charts | Influence Diagram Software | Marketing ...
- Influence Diagram Software | ConceptDraw DIAGRAM Compatibility ...
- Types of Flowcharts | Affinity Diagram | PDPC | Influence Diagram Pmp
- Decision tree | Fault Tree Diagram | Influence Diagram | Example Of ...
- SDL Diagram | Influence Diagram | Basketball Court Dimensions ...
- Influence Diagram Software | Leadership Training Influence | Entity ...
- Influence diagram
- Cause and Effect Analysis | Influence Diagram Software | Decision ...
- Decision Making | Derivative works decision tree | Influence ...
- Activity on Node Network Diagramming Tool | Influence Diagram ...
- Types of Flowcharts | Process Flowchart | Influence Diagram | Make ...
- Process Flowchart | Influence Diagram Software | Fishbone Diagram ...