Pyramid Diagram and Pyramid Chart

PDPC

Competitor Analysis

 Seven Management and Planning Tools
Seven Management and Planning Tools solution extends ConceptDraw DIAGRAM and ConceptDraw MINDMAP with features, templates, samples and libraries of vector stencils for drawing management mind maps and diagrams.
Risk Diagram (Process Decision Program Chart)

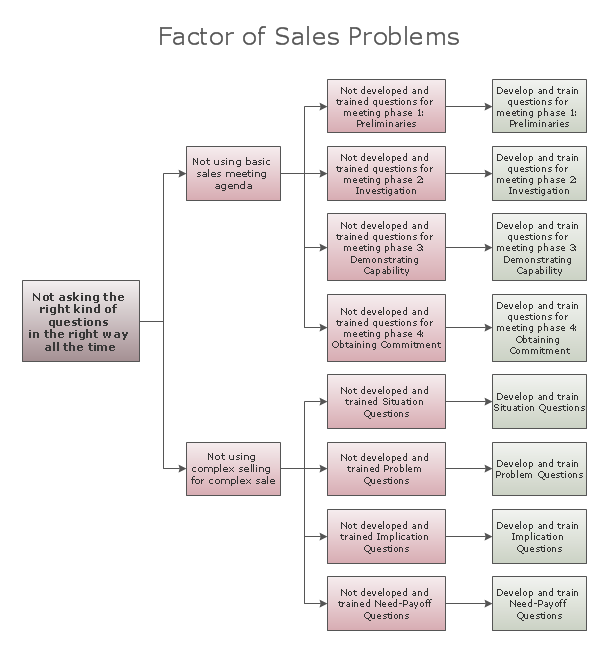
Root Cause Tree Diagram

Six Markets Model Chart

Cross-Functional Flowchart


Affinity Diagram

Root Cause Tree Diagram
- Influence Diagram | Influence Diagram Software | Pyramid Diagram ...
- Cause and Effect Analysis | Influence Diagram Software | Decision ...
- Cause and Effect Analysis | Influence Diagram Software | Decision ...
- Fault Tree Diagram | Marketing Charts | Influence Diagram Software ...
- Influence Diagram Software | Decision Making | Cause and Effect ...
- Fault Tree Analysis Diagrams | High Level Tree Diagram Excel
- Risk diagram (PDPC) - Template | Top 5 Android Flow Chart Apps ...
- Triangle Chart Excel
- Download Work Flow Chart Excel