Line Chart Template for Word

Chart Maker for Presentations

Chart Templates

Pie Chart Word Template. Pie Chart Examples

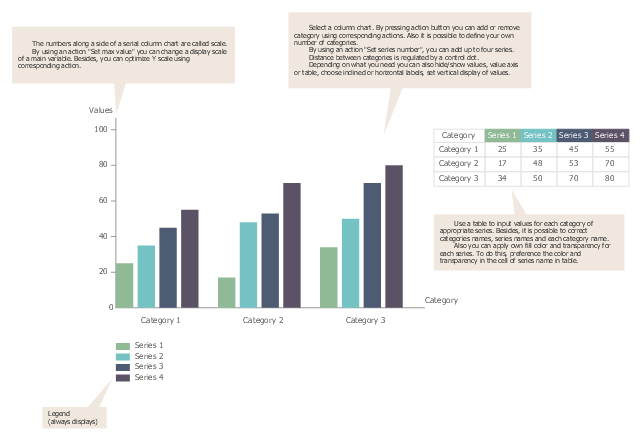
Use this bar graph template to design your column charts for 1-4 data series.
"Bar charts have a discrete range. Bar charts are usually scaled so all the data can fit on the chart. Bars on the chart may be arranged in any order. Bar charts arranged from highest to lowest incidence are called Pareto charts. Normally, bars showing frequency will be arranged in chronological (time) sequence. Grouped bar graph usually present the information in the same order in each grouping. Stacked bar graphs present the information in the same sequence on each bar.
Bar charts provide a visual presentation of categorical data. Categorical data is a grouping of data into discrete groups, such as months of the year, age group, shoe sizes, and animals. These categories are usually qualitative. In a column bar chart, the categories appear along the horizontal axis; the height of the bar corresponds to the value of each category." [Bar chart. Wikipedia]
The template "Bar chart" for the ConceptDraw PRO diagramming and vector drawing software is included in the Bar Graphs solution from the Graphs and Charts area of ConceptDraw Solution Park.
Template
Sales Growth. Bar Graphs Example

Bar Chart Template for Word

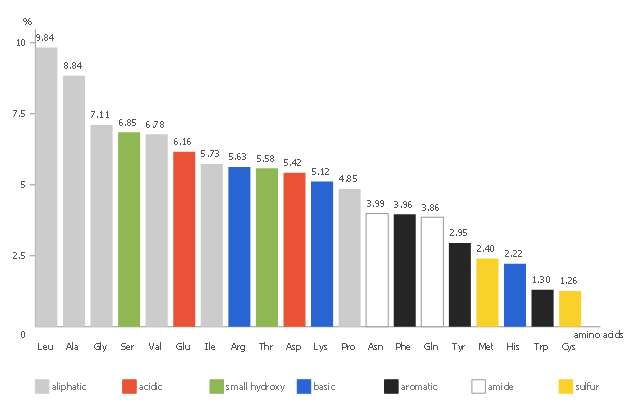
This vertical bar chart sample shows the amino acid composition in percent for the complete UniProtKB/ TrEMBL protein database release 2016_ 07. It was designed using statistic data from the website of UniProt protein sequence database. [ebi.ac.uk/ uniprot/ TrEMBLstats]
"The mission of UniProt is to provide the scientific community with a comprehensive, high quality and freely accessible resource of protein sequence and functional information." [ebi.ac.uk/ uniprot]
The column chart example "Amino acid composition of complete UniProt database" was created using the ConceptDraw PRO diagramming and vector drawing software extended with the Bar Graphs solution from the Graphs and Charts area of ConceptDraw Solution Park.
Column chart
Pyramid Diagram and Pyramid Chart

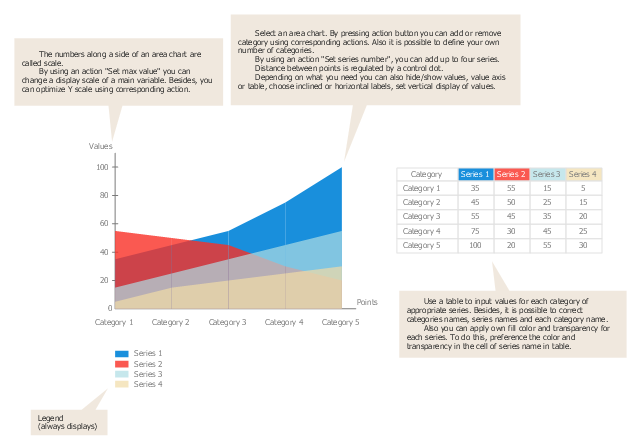
Use this template to design your area graphs.
"An area chart or area graph displays graphically quantitive data. It is based on the line chart. The area between axis and line are commonly emphasized with colors, textures and hatchings. Commonly one compares with an area chart two or more quantities.
Area charts are used to represent cumulated totals using numbers or percentages (stacked area charts in this case) over time. Use the area chart for showing trends over time among related attributes. The area chart is like the plot chart except that the area below the plotted line is filled in with color to indicate volume.
When multiple attributes are included, the first attribute is plotted as a line with color fill followed by the second attribute, and so on." [Area chart. Wikipedia]
The template "Area chart" for the ConceptDraw PRO diagramming and vector drawing software is included in the Area Charts solution from the Graphs and Charts area of ConceptDraw Solution Park.
Template
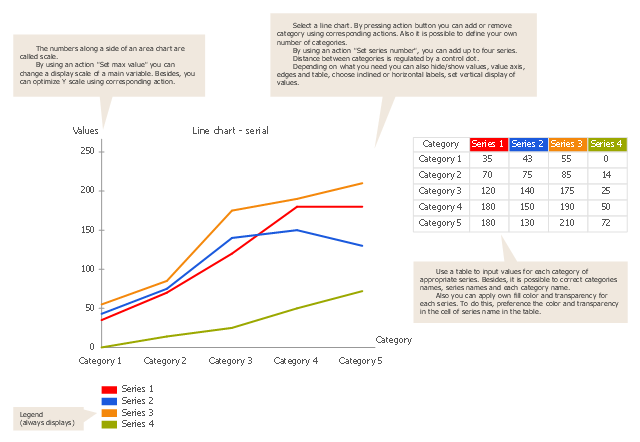
Use this template to design your line graphs.
"A time series is a sequence of data points, measured typically at successive points in time spaced at uniform time intervals. ... Time series are very frequently plotted via line charts. Time series are used in statistics, signal processing, pattern recognition, econometrics, mathematical finance, weather forecasting, earthquake prediction, electroencephalography, control engineering, astronomy, and communications engineering. Time series analysis comprises methods for analyzing time series data in order to extract meaningful statistics and other characteristics of the data. Time series forecasting is the use of a model to predict future values based on previously observed values. While regression analysis is often employed in such a way as to test theories that the current values of one or more independent time series affect the current value of another time series, this type of analysis of time series is not called "time series analysis", which focuses on comparing values of time series at different points in time. Time series data have a natural temporal ordering." [Time series. Wikipedia]
The line graph template for the ConceptDraw PRO diagramming and vector drawing software is included in the Line Graphs solution from the Graphs and Charts area of ConceptDraw Solution Park.
Template
Column Chart Template

Pie Chart Software

Donut Chart Templates

Bar Chart Software

- Line Chart | Basic Diagramming | Line Chart Template for Word ...
- Area Graph Template
- Line Chart Template for Word | Pie Chart Word Template . Pie Chart ...
- Picture Chart Templates
- Line Graph Chart Templates
- Bar Chart Template for Word | Column Chart Template | Chart Maker ...
- Bar Graphs | Line Graphs | Picture Graphs | Graphs
- Sales Growth. Bar Graphs Example | Bar Chart Examples | Bar ...
- Free Ppt Sample Templates With Graphs And Charts
- Picture graph template | Design elements - Picture graphs | Graphs ...
- Chart And Graph Examples On Sales
- Pie Chart Word Template
- Line Chart Template for Word | Bar Chart Template for Word | Pie
- Bar Chart Template
- Chart Examples | Design elements - Pie charts | Donut chart ...
- Bar Chart Template for Word | Line Chart Template for Word | Pie
- Line Graph Charting Software | Line Graphs | Line Chart Template ...
- Bar chart - Template | Bar Graph | How to Create a Sales Dashboard ...
- Picture Graphs | Picture graphs - Vector stencils library | Picture ...
- Picture Graph | Pictures of Graphs | Line Chart Template for Word ...