Prioritization Matrix

Workflow Diagram

Business Board Org Chart

CORRECTIVE ACTIONS PLANNING. Involvement Matrix


Flowchart Marketing Process. Flowchart Examples

Cause and Effect Analysis

The Action Plan

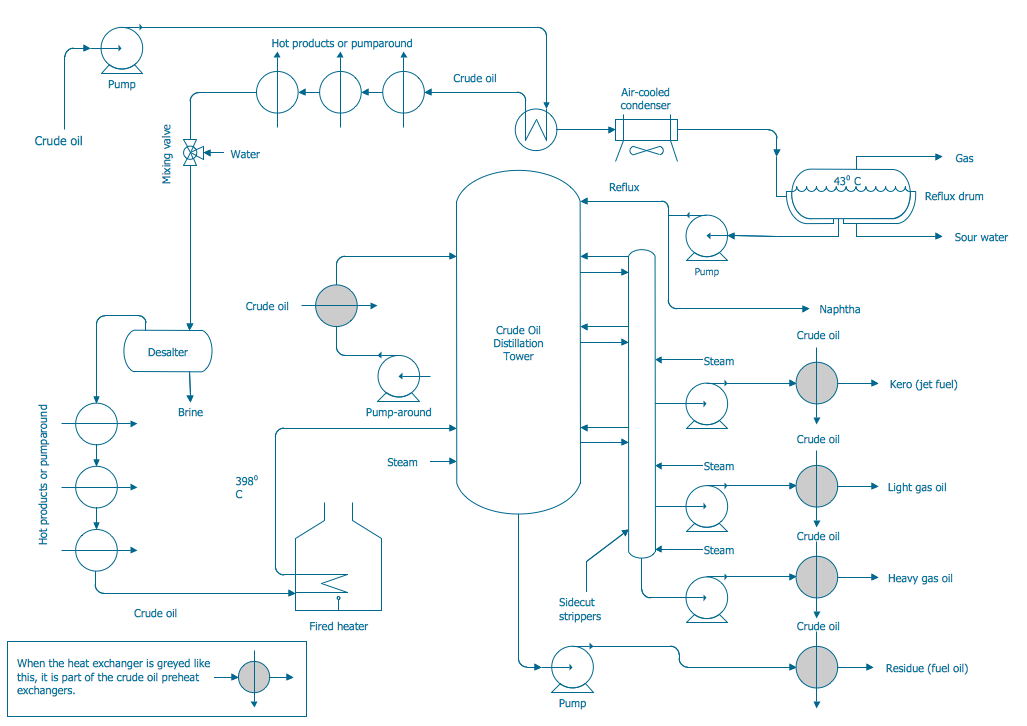
Process and Instrumentation Diagram
Network Topologies


CORRECTIVE ACTIONS PLANNING. Risk Diagram (PDPC)

Pyramid Diagram and Pyramid Chart

Affinity Diagram

Influence Diagram Software

How to Design Landscape

7 Management & Planning Tools

- How To Create an Involvement Matrix | Matrix Organization Structure ...
- Process Flowchart | Prioritization Matrix | Management Consultant ...
- Pyramid Diagram | Priority pyramid diagram | PROBLEM ANALYSIS ...
- How To use House Design Software | Prioritization Matrix | How To ...
- How to Create a Workflow Diagram Using ConceptDraw Solution Park
- PERT Chart Software | Prioritization Matrix | Activity Network (PERT ...
- How To Create an Involvement Matrix | CORRECTIVE ACTIONS ...
- Audit process flowchart (multipage) | Prioritization Matrix | Flow ...
- Porter's generic strategies matrix diagram | Pyramid Chart Examples ...
- Root Cause Analysis Flow Chart Examples
- Authority Matrix Diagram Software | Porter's value chain matrix ...
- How To Create a Workflow Diagram | How to Create a Workflow ...
- Swot Analysis Of Software Department Example
- How to Add a Workflow Diagram to a PowerPoint Presentation ...
- Ice Hockey Diagram – Deke Technique | Collaboration in a Project ...
- How to Create a SWOT Matrix Quickly | How to Create SWOT ...
- How To Implement Collaborative Project Management | Drawing ...
- Entity-Relationship Diagram (ERD) with ConceptDraw PRO ...
- PERT Chart | Program Evaluation and Review Technique (PERT ...
- Fault tree analysis - Insulin delivery system | Process Flowchart ...