This site uses cookies. By continuing to browse the ConceptDraw site you are agreeing to our Use of Site Cookies.
HelpDesk

How to Create a Workflow Diagram Using ConceptDraw Solutions

A workflow diagram is a specialized type of flowchart. With the help of a workflow diagram you can visually describe the tasks, documents, people responsible for execution at each stage of workflow. The ability to create Workflow diagrams is contained in the ConceptDraw Workflow Diagrams solution.

How To Create a Workflow Diagram

A workflow diagram is less general notation than a process flow diagram. Workflow as a term can apply to organizational process which involves people, resources, documents, sort of data, for instance; whereas a process is general collection of steps occuring in any sort of activity. That is why process flow diagram can be used as workflow diagram to describe business process, data flow or department interactions.

The fastest way to create a workflow diagram is using pre-designed workflow template. ConceptDraw DIAGRAM with the Workflow Diagrams solution delivers rich set of workflow diagram templates you may start from.

workflow diagram software, workflow patterns Workflow Diagrams

workflow diagram software, workflow patterns
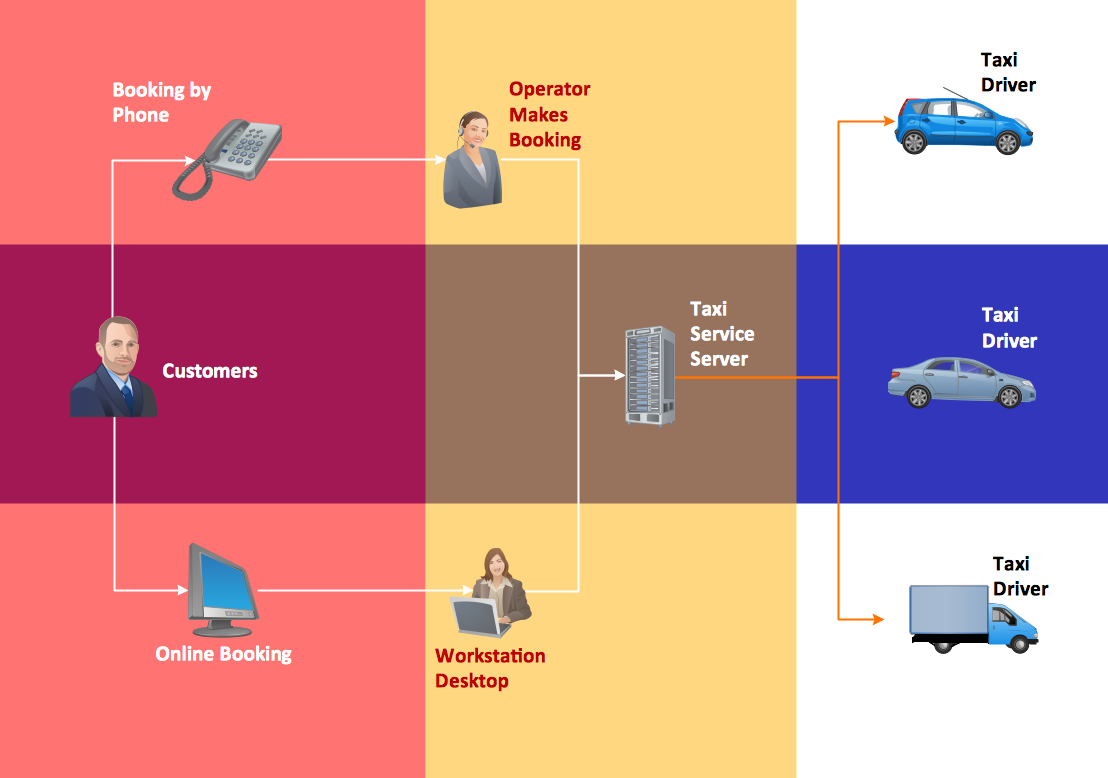
Workflow Diagrams solution extends ConceptDraw DIAGRAM software with samples, templates and vector stencils library for drawing the work process flowcharts.

Workflow Diagram Symbols

Workflow diagrams is the acknowledged method to draw processes which have concerted set of symbols you use for depicting different kind of steps or relations. Often it named the process flow diagram but the real process flow diagram use differen visual notations and use different flowchart symbols. The professional workflow diagram also may be used for the same purpose as critical process flow diagram. Nevertheless, there are lots of cases you may need make your workflow diagram more bright and graphic. ConceptDraw DIAGRAM extended with the Workflow Diagram solution delivers rich set of workflow diagram symbols helps you make your workflow better-suited for presentations.
HelpDesk

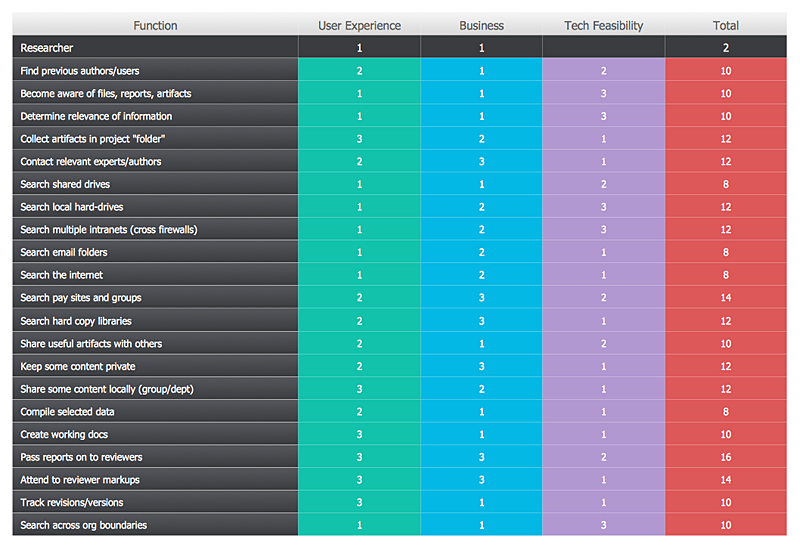
How To Create a Prioritization Matrix

Making the prioritization matrix is helpful when all cannot be done at the same time. Prioritization matrix diagram shows the relationships between factors and this helps, to prioritize tasks and resources. This helps you to narrow down variants. By selecting and weighing options you can quickly determine the best choices and direct team to the best destinations. Prioritization matrix helps to identify the best way of implementing the most priority tasks. It is helpful in a case when you have limited resources. ConceptDraw solution for management and planning compiled from the Seven Management and Planning Tools provides the ability to quickly build Prioritization Matrix diagrams for your project using a special template.
HelpDesk

How to Draw a Chemical Process Flow Diagram

Process Flow Diagram widely used in modeling of processes in the chemical industry. A Chemical Process Flow diagram (PFD) is a specialized type of flowchart. With the help of Chemical Process Flow Diagram, engineers can easily specify the general scheme of the processes and chemical plant equipment. Chemical Process Flow Diagram displays the real scheme of the chemical process, the relationship between the equipment and the technical characteristics of the process. Chemical Process Flow Diagram illustrates the connections between the basic equipment as well as the overall structure of pipelines and other supporting equipment. The purpose of the PFD is to build the image of the basic idea of ​the chemical process. ConceptDraw DIAGRAM together with its Chemical and Process Engineering solution delivers the possibility to design Chemical Process Flow diagrams. It is designed for chemical industry engineers and designers.
HelpDesk

How to Create a Cross-Functional Flowchart

Cross-functional flowcharts are used to visualize cross-functional processes. The cross-functional process is a process that involves multiple divisions, each of which makes its part of the entire company workflow. For example product development, lead management, client orders processing – and other critical processes. All of them are important both for business and customers, but the workflow and responsibilities distribution within these processes are divided between multiple departments and services. Cross-functional processes cannot be depicted with simple workflow diagrams, because of the specific interactions between company departments. ConceptDraw DIAGRAM has released a specialized solution to create cross-functional diagrams. Cross-Functional Flowcharts solution includes a special set of templates and libraries to depict the cross-functional processes.
HelpDesk

How to Create an Accounting Flowchart

An Accounting flowchart is a specialized type of flowchart. With the help of an accounting flowchart, you can visually describe tasks, documents, people responsible for execution at each stage of the accounting workflow. Find out how you can easily create an accounting flowchart of any complexity using Accounting Flowchart Solution from the ConceptDraw Solution Park.

Flowchart Software

Flowchart is widely used in business, education and economic presentations to help the audience visualize the content better, or to find flaws in a process flow diagrams. Flowcharts are particularly useful for displaying how a process currently flow or could ideally function. Flowcharts can help you see whether the steps of a process are logical, uncover problems or miscommunications, define the boundaries of a process, and develop a common base of knowledge about a process.

ConceptDraw DIAGRAM flowchart software will help to quickly create new flowcharts, workflow, NS Diagram, BPMN Diagram, Cross-functional flowcharts, data flow diagrams and highlight flowcharts.

Feature-rich flowchart maker, free thousand flowchart examples and templates and colored symbols that will allow you to create professional looking flowcharts simply.

ConceptDraw DIAGRAM supports macOS and Windows.
How to Build a Flowchart
HelpDesk

How to Create a Timeline Diagram

A Timeline is a chart which displays a project plan schedule in chronological order. A Timeline is used in project management to depict project milestones and visualize project phases and show project progress. The graphic form of a timeline makes it easy to understand critical project milestones, such as the progress of a project schedule. Timelines are particularly useful for project scheduling or project management when accompanied with a Gantt chart. It captures the main of what the project will accomplish and how it will be done. making a project timeline is one of the most important skills a project manager needs have. Making comprehensive, accurate timelines allows you getting every project off in the best way. ConceptDraw DIAGRAM allows you to draw a timeline chart using a special library.
HelpDesk

How to Create a Bubble Diagram

Bubble Diagram is a simple chart that consists of circles (bubbles) repesening certain topics or processes. Bubbles are connected by lines depicting the type of relationships between the bubbles. The size of each bubble is depended on the importance of the entity it represents. Bubble charts are widely used throughout social, economical, medical, and other scientific researches as well as throughout architecture and business management. Bubble charts are often used during the early stages of product development to visualize thoughts and ideas for the purpose of sketching out a development plan. ConceptDraw DIAGRAM allows you to draw a bubble diagrams using the Bubble Diagrams solution.
HelpDesk

How to Create Management Infographics

Management might want to communicate a basic workflow for each division of the company, visualize business strategy and decision processes, or display a certain business training concept. In this case, an infographic can be more text heavy and use illustrations to establish a timeline, process, or step-by-step sequence of events.
ConceptDraw DIAGRAM can be used as a tool for creating management infographics. It allows you to draw infographics quickly and easily using the special templates and vector stencils libraries. Infographics can be used to quickly communicate a message, to simplify the presentation of large amounts of data, to see data patterns and relationships, and to monitor changes in variables over time. It can contain bar graphs, pie charts, histograms, line charts, e.t.c.
HelpDesk

How to Create Flowchart Using Standard Flowchart Symbols

Flowcharts are used to display an algorithm for consistent execution of certain steps. A flowchart is probably the easiest way to make a graphical representation of any process. Flowcharts use the set of standard geometric symbols and arrows to define relationships. ConceptDraw DIAGRAM allows you to create professional flowchart quickly and easily. The ability to create flowcharts is contained in the Flowcharts solution. The solution provides a set of special tools for creating flowcharts.
HelpDesk

How to Create a New Library

Sometimes, when creating a diagram, you need to use a large set of elements from different libraries. If you are using ConceptDraw , in such case, we recommend you to create a new library, which consists of vector library objects from other ConceptDraw libraries. You also can add some custom unique objects into such library. Each object that contains in a new library can be provided with a unique description and keyword list.
Thus, the new library and its objects will be indexed to be searched and used in the further diagrams.
HelpDesk

How to Create a BPMN Diagram

Business Process Modeling Notation (BPMN) is a method of illustrating business processes in the form of a diagram. The most effective method of creating or analyzing a business process is to visually interpret the steps using a business process diagram, flowchart or workflow. This is known as business process modeling and will be performed within a company by a team who have detailed knowledge of company process, and analysts with expertise in the modeling discipline. The objective is often to increase production or lower costs — by modeling the process initially using a flowchart, inefficiencies and problems can be spotted before committing to a decision or strategy. You can create BPMN diagrams using the ConceptDraw DIAGRAM diagramming tools. ConceptDraw has designed a solution that combines BPMN v2.0 methodology and graphical notification into one powerful package. The Business Process Diagrams solution from ConceptDraw Solution Park provides a comprehensive collection of vector