Products
Solutions
Samples
Contact Us
Buy
Helpdesk
✕
Sign In
Sign In
My ConceptDraw
Profile
Cart 
Activate
My Activated Licenses
Upgrade Information
Download Product
Open Support Ticket
Sign Out
This site uses cookies. By continuing to browse the ConceptDraw site you are agreeing to our Use of Site Cookies.
Helpdesk  >  ConceptDraw DIAGRAM  >    Business-specific Drawings

How to Create Management Infographics

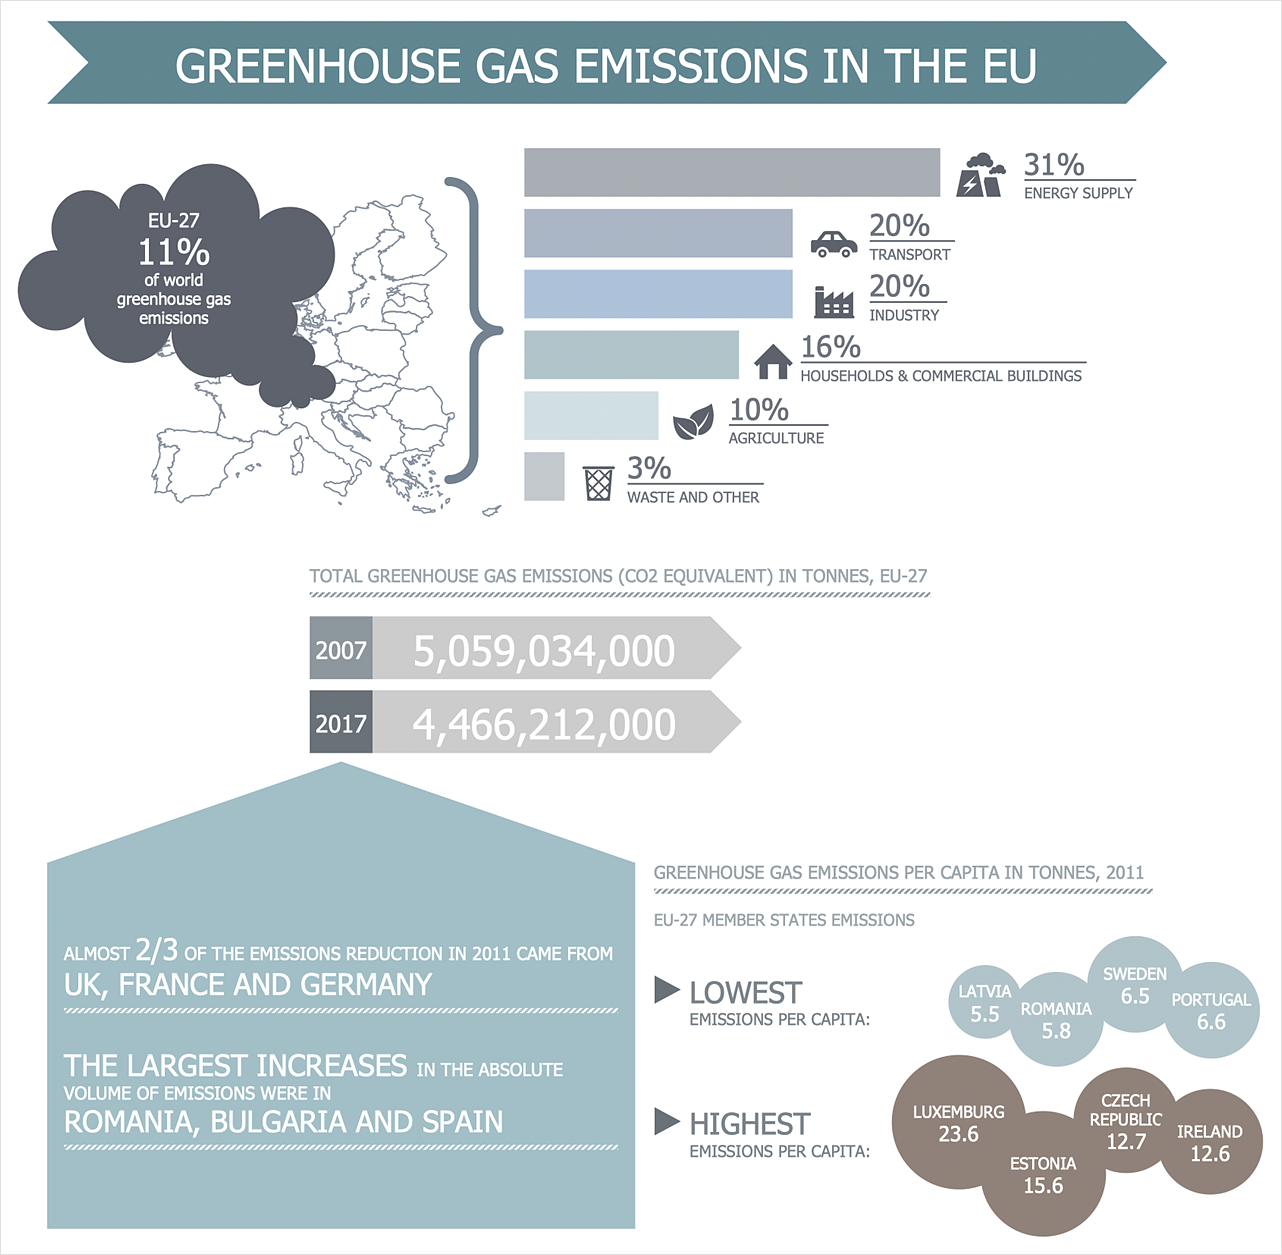
Infographics are used in management to display and condense information into a single, visually-appealing image. Management infographics can contain detailed illustrations, bar graphs, pie charts, histograms, and line charts, for example.
The ConceptDraw Management Infographics solution is a paid add-on to ConceptDraw DIAGRAM, that provides users with a powerful and easy to use Management Infographics tool at a low price.

  1. Run ConceptDraw DIAGRAM.
  2. Select the Management Infographics item in the Solutions panel.
  3. Cclick the preview of the Management Infographics template to open it.
  4. Now you have a workspace and a set of corresponding libraries enabling you to develop management infographics.
  5. Add objects to the drawing by dragging them from the library to the document page.
  6. To make changes to your infographic elements use the Action button menu. To open the menu select an object and click the action button action button in the upper right corner of the object.
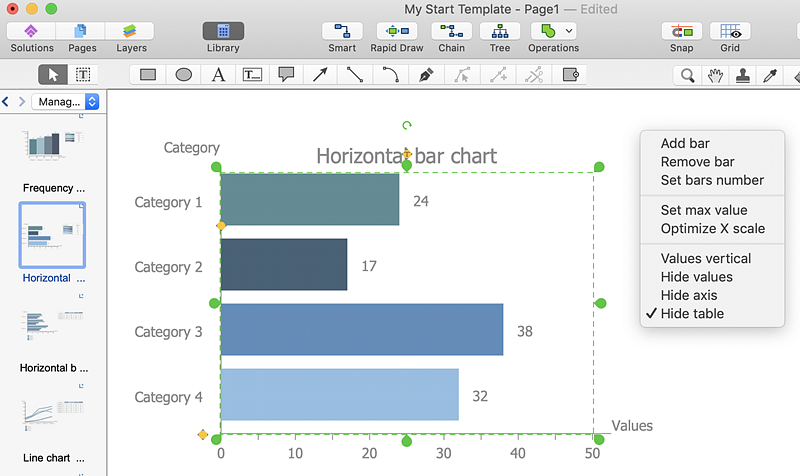
  7. management-infographics-chart
  8. To change value of an interactive chart, select it and type the new value and the chart will be automatically changed.
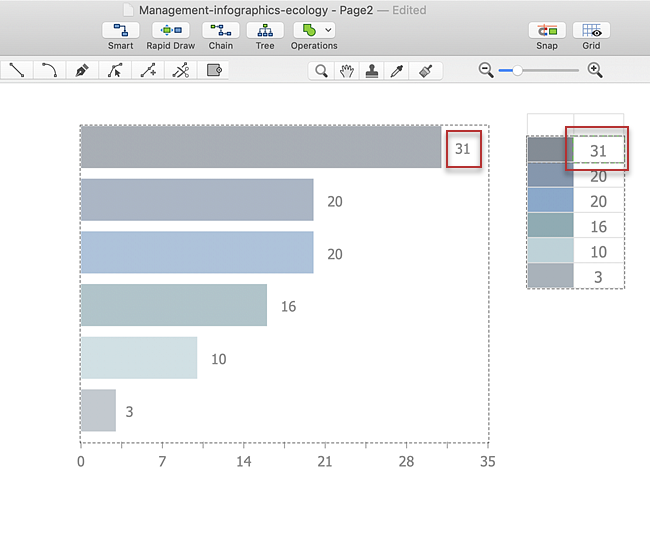
  9. management-infographics-chart
  10. Use Text tools to add text to your infographics.
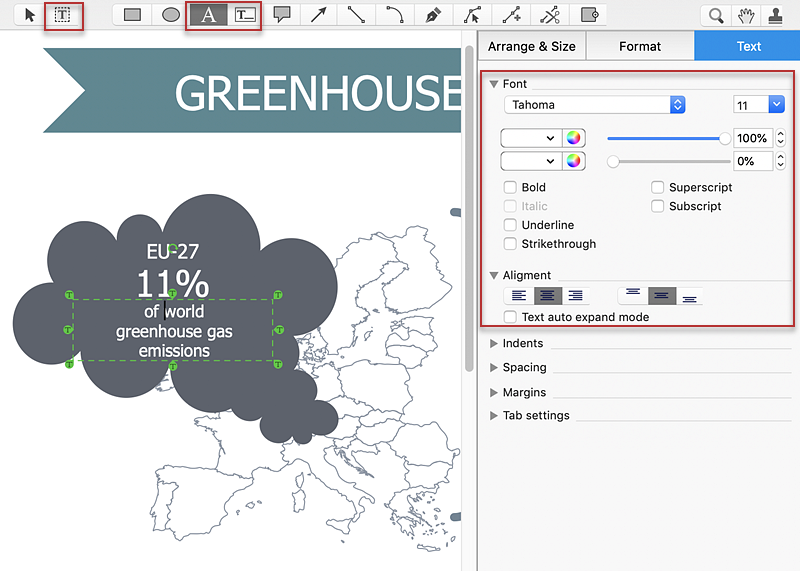
  11. management-infographics-chart
  12. Finally, you can export your drawing as MS PowerPoint® and Adobe PDF using the Export options from the File menu.
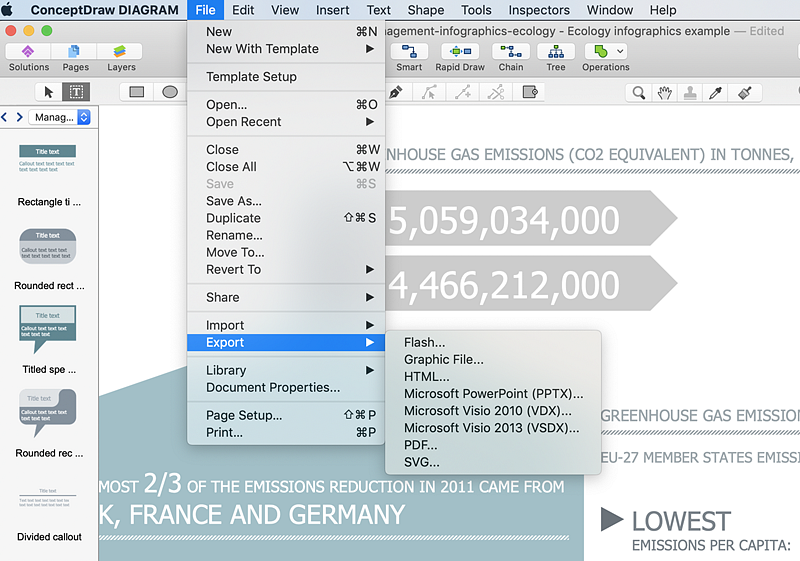
  13. management-infographics-chart

Result: Management Infographics can be used to simplify the presentation of large amounts of data, to see data patterns and relationships, and to monitor changes in variables over time. Using ConceptDraw DIAGRAM you can quickly make management infographics of any complexity.

How to Create Management Infographics

How it works:

  • Set of ready-to-use templates supplied with ConceptDraw DIAGRAM
  • Collection of professional samples supports each template

Useful Solutions and Products:

Diagrams area
  • Easily draw charts and diagrams.
  • Visualize business information
  • Block Diagrams
  • Bubble Diagrams
  • Circle-Spoke Diagrams
  • Circular Arrows Diagrams
  • Concept Maps
  • Flowcharts
  • Venn Diagrams

Business Infographics
  • Marketing Infographics
  • Management Infographics
  • Education Infographics
  • Business Infographics samples
  • Business Infographics Tool

ConceptDraw DIAGRAM
  • Diagraming and Charts
  • Vector Illustrations
  • Maps
  • Floor plans
  • Engineering drawings
  • Business dashboards
  • Infographics
  • Presentation
  • Over 10 000 vector stencils
  • Export to vector graphics files
  • Export to Adobe Acrobat® PDF
  • Export to MS PowerPoint®
  • Export to MS Visio® VSDX, VDX

Products

  • ConceptDraw OFFICE v11
  • ConceptDraw DIAGRAM v18
  • ConceptDraw MINDMAP v16
  • ConceptDraw PROJECT v15
  • ConceptDraw STORE
  • ConceptDraw BOOKS

Solutions

  • Free
  • Premium

Samples

Support

  • Technical Support
  • Upgrade Request
  • Visio File Conversion
  • System Requirements
  • Helpdesk
  • Students & Educators
  • Enterprise
  • Customer Service

Solutions

  • Free
  • Premium

Samples

Video Room

  • Products
  • Solutions

Ready To Buy

  • Buy Online
  • Reseller Partners
  • Manage Your Account
  • Download Your Software
  • CS Odessa

    • About Us
    • Contact Us
    • CS Odessa Identity
    • News
  • CS Odessa
    Plan. Do. Communicate.

    About Us | Contact Us | Feedback | EULA | Privacy | TOU | TOS
    © 1993 — 2025 CS Odessa Corp.