A four level pyramid model of different types of Information Systems based on the different levels of hierarchy in an organization. The first level represents transaction processing systems for workers. The second level represents management information systems for middle managers. The third level represents decision support systems for senior menegers. The fourth level represents executive information systems for executives.
"The "classic" view of Information systems found in the textbooks in the 1980s was of a pyramid of systems that reflected the hierarchy of the organization, usually transaction processing systems at the bottom of the pyramid, followed by management information systems, decision support systems, and ending with executive information systems at the top. Although the pyramid model remains useful, since it was first formulated a number of new technologies have been developed and new categories of information systems have emerged, some of which no longer fit easily into the original pyramid model.
Some examples of such systems are:
data warehouses,
enterprise resource planning,
enterprise systems,
expert systems,
search engines,
geographic information system,
global information system,
office automation." [Information systems. Wikipedia]
This diagram was redesigned using the ConceptDraw PRO diagramming and vector drawing software from Wikimedia Commons file Four-Level-Pyramid-model.png. [commons.wikimedia.org/ wiki/ File:Four-Level-Pyramid-model.png]
This file is licensed under the Creative Commons Attribution-Share Alike 3.0 Unported license. [creativecommons.org/ licenses/ by-sa/ 3.0/ deed.en]
The triangle chart example "Information systems types" is included in the Pyramid Diagrams solution from the Marketing area of ConceptDraw Solution Park.
Pyramid diagram

Pyramid Diagram

Pyramid Diagram

Pyramid Diagram

Pyramid Diagram

Pyramid Diagram

Venn Diagram Examples for Problem Solving. Computer Science. Chomsky Hierarchy

A five level pyramid model of different types of Information Systems based on the information processing requirement of different levels in the organization. The first level represents transaction processing systems to process basic data. The second level represents office support systems to process information in office. The third level represents management information systems to process information by managers. The fourth level represents decision support systems to process explicit knowledge. The fifth level represents executive information systems to process tacit knowledge.
"A Computer(-Based) Information System is essentially an IS using computer technology to carry out some or all of its planned tasks. The basic components of computer based information system are:
(1) Hardware - these are the devices like the monitor, processor, printer and keyboard, all of which work together to accept, process, show data and information.
(2) Software - are the programs that allow the hardware to process the data.
(3) Databases - are the gathering of associated files or tables containing related data.
(4) Networks - are a connecting system that allows diverse computers to distribute resources.
(5) Procedures - are the commands for combining the components above to process information and produce the preferred output.
The first four components (hardware, software, database and network) make up what is known as the information technology platform. Information technology workers could then use these components to create information systems that watch over safety measures, risk and the management of data. These actions are known as information technology services." [Information systems. Wikipedia]
This pyramid diagram was redesigned using the ConceptDraw PRO diagramming and vector drawing software from Wikimedia Commons file Five-Level-Pyramid-model.png. [commons.wikimedia.org/ wiki/ File:Five-Level-Pyramid-model.png]
This file is licensed under the Creative Commons Attribution 3.0 Unported license. [creativecommons.org/ licenses/ by/ 3.0/ deed.en]
The triangle chart example "Information systems types" is included in the Pyramid Diagrams solution from the Marketing area of ConceptDraw Solution Park.
Pyramid diagram

Data Flow Diagram

Pyramid Diagram and Pyramid Chart

This example of a Top Level Context Diagram for an information system management process was redesigned from the Wikipedia file: IDEF Top-Level Context Diagram.jpg. [en.wikipedia.org/ wiki/ File:IDEF_ Top-Level_ Context_ Diagram.jpg]
"Graphical notation.
IDEF0 is a model that consists of a hierarchical series of diagrams, text, and glossary cross referenced to each other. The two primary modeling components are:
(1) functions (represented on a diagram by boxes), and
(2) data and objects that interrelate those functions (represented by arrows).
... the position at which the arrow attaches to a box conveys the specific role of the interface. The controls enter the top of the box. The inputs, the data or objects acted upon by the operation, enter the box from the left. The outputs of the operation leave the right-hand side of the box. Mechanism arrows that provide supporting means for performing the function join (point up to) the bottom of the box.
The IDEF0 process.
The IDEF0 process starts with the identification of the prime function to be decomposed. This function is identified on a “Top Level Context Diagram,” that defines the scope of the particular IDEF0 analysis. ... From this diagram lower-level diagrams are generated." [IDEF0. Wikipedia]
The IDEF0 diagram example "Top-level context diagram" was created using the ConceptDraw PRO diagramming and vector drawing software extended with the IDEF0 Diagrams solution from the Software Development area of ConceptDraw Solution Park.
IDEF0 diagram

Process Flowchart


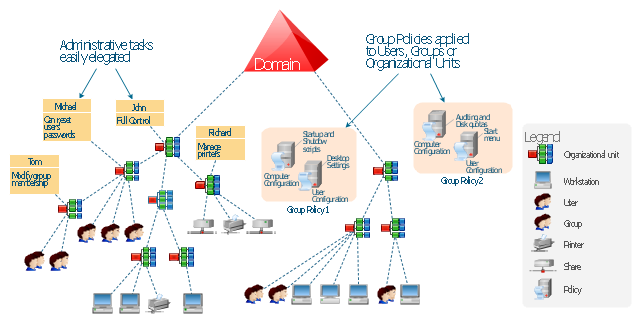
This example was drawn on the base of the Figure 2 illustrating the "Active Directory FAQ" from the website "Information Management Systems & Services" (IMSS) of the California Institute of Technology (Caltech) campus. [imss.caltech.edu/ node/ 412]
"By using the Active Directory® Domain Services (AD DS) server role, you can create a scalable, secure, and manageable infrastructure for user and resource management, and you can provide support for directory-enabled applications, such as Microsoft® Exchange Server. ...
AD DS provides a distributed database that stores and manages information about network resources and application-specific data from directory-enabled applications. Administrators can use AD DS to organize elements of a network, such as users, computers, and other devices, into a hierarchical containment structure. The hierarchical containment structure includes the Active Directory forest, domains in the forest, and organizational units (OUs) in each domain. A server that is running AD DS is called a domain controller." [technet.microsoft.com/ en-us/ library/ 9a5cba91-7153-4265-adda-c70df2321982]
The Active Directory Domain Services diagram example was created using the ConceptDraw PRO diagramming and vector drawing software extended with the Active Directory Diagrams solution from the Computer and Networks area of ConceptDraw Solution Park.
Active Directory hierarchical structure
 House of Quality
House of Quality solution provides the powerful drawing tools, numerous specific samples and examples, and set of vector design elements of House of Quality shapes and symbols, which will help you in application the Quality function deployment (QFD) methodology and in easy creation the House of Quality Matrices intended for satisfaction the consumers' desires and requirements, for representing them in a visual way and then transformation into the targets and technical requirements to be followed for development the best products.
Data structure diagram with ConceptDraw DIAGRAM

Active Directory Diagram

How to Draw an Organization Chart

UML Class Diagram Generalization Example UML Diagrams

Pyramid Chart Examples

Matrix Organization Structure

- 4 Level pyramid model diagram - Information systems types | Identify ...
- 4 Level pyramid model diagram - Information systems types | How to ...
- Types Of Information System Based On Hierarchy
- 4 Level pyramid model diagram - Information systems types | Types ...
- 5 Level pyramid model diagram - Information systems types | 4 Level ...
- 4 Level pyramid model diagram - Information systems types ...
- 4 Level pyramid model diagram - Information systems types | 5 Level ...
- 4 Level pyramid model diagram - Information systems types | Control ...
- 4 Level pyramid model diagram - Information systems types | Office ...
- 4 Level pyramid model diagram - Information systems types ...
- 4 Level pyramid model diagram - Information systems types | 5 Level ...
- With The Aid Of Diagram Explain An Information System
- Four Level Hierarchy Of Information System
- Explain Haierarchy Inforatin System With Diagram
- Explain The Hierarchy Of Management And Draw Diagram
- 4 Level pyramid model diagram - Information systems types ...
- Explain The Three Levels Of Information And Their Examples
- Pyramid Diagrams | Draw The Model Of Marketing Information System
- Explain Four Level Of Information System
- Pyramid Diagram | Pyramid Diagram | 5 Level pyramid model ...