This site uses cookies. By continuing to browse the ConceptDraw site you are agreeing to our Use of Site Cookies.

Process Flowchart

ConceptDraw is Professional business process mapping software for making process flow diagram, workflow diagram, general flowcharts and technical illustrations for business documents. It is includes rich examples, templates, process flowchart symbols. ConceptDraw flowchart maker allows you to easier create a process flowchart. Use a variety of drawing tools, smart connectors, flowchart symbols and shape libraries to create flowcharts of complex processes, process flow diagrams, procedures and information exchange.
How To Create a Process Flow Chart (business process modelling techniques)

Types of Flowchart - Overview

When designing a process or an instruction in clear way, you should consider creating a flowchart. A Process Flow Diagram is the method. You can avoid wasting a lot of time understanding complex concepts as they get clear with different diagrams.
How to Simplify Flow Charting

Flow chart Example. Warehouse Flowchart

Warehouse Flowcharts are different diagrams describing wharehousing and inventory menagement processes. Typical purposes of warehouse flowcharts are evaluating warehouse performance and organizational performance, measuring efficiency of customer service. This type of workflow diagrams can be used for identifying any disconnection between business activities and business objectives.
Standard warehousing process flow diagram and standard workflow diagram used for process identification for further evaluating effectiveness and profitability of overall business process. Use the ConceptDraw PRO diagramming and vector drawing software extended with the Flowcharts solution from the Diagrams area of ConceptDraw Solution Park to design your own workflow diagrams, process flow diagram and flow charts. Need to use Process Flow Diagram for designing Warehouse packages flow.
ConceptDraw Arrows10 Technology

Total Quality Management Value

The Total Quality Management Diagram solution helps you and your organization visualize business and industrial processes. Create Total Quality Management diagrams for business process with ConceptDraw software.

entity-relationship diagram, ER-diagram, database ERD Entity-Relationship Diagram (ERD)

entity-relationship diagram, ER-diagram, database ERD
Entity-Relationship Diagram (ERD) solution extends ConceptDraw PRO software with templates, samples and libraries of vector stencils from drawing the ER-diagrams by Chen's and crow’s foot notations.

fishbone diagram, Ishikawa diagram, cause and effect analysis Fishbone Diagram

fishbone diagram, Ishikawa diagram, cause and effect analysis
Fishbone Diagrams solution extends ConceptDraw PRO software with templates, samples and library of vector stencils for drawing the Ishikawa diagrams for cause and effect analysis.

Cause and Effect Diagram

ConceptDraw PRO software extended with Fishbone Diagrams solution from the Management area of ConceptDraw Solution Park is perfect for Cause and Effect Diagram creating. It gives the ability to draw fishbone diagram that identifies many possible causes for an effect or a problem. Causes and Effects are usually grouped into major categories to identify these sources of variation. Causes and Effects in the diagram show relationships among various factor. Fishbone diagram shows factors of Equipment, Process, People, Materials, Environment and Management, all affecting the overall problem.

Basic Flowchart Symbols and Meaning

Flowchart Symbols and Meaning - Provides a visual representation of basic flowchart symbols and their proposed use in professional workflow diagram, standard process flow diagram and communicating the structure of a well-developed web site, as well as their correlation in developing on-line instructional projects. See flowchart's symbols by specifics of process flow diagram symbols and workflow diagram symbols.
How to Build a Flowchart

data flow diagram, DFD templates Data Flow Diagrams (DFD)

data flow diagram, DFD templates
Data Flow Diagrams solution extends ConceptDraw PRO software with templates, samples and libraries of vector stencils for drawing the data flow diagrams (DFD).

fishbone diagram, Ishikawa diagram, cause and effect analysis Fishbone Diagrams

fishbone diagram, Ishikawa diagram, cause and effect analysis
The Fishbone Diagrams solution extends ConceptDraw PRO v10 software with the ability to easily draw the Fishbone Diagrams (Ishikawa Diagrams) to clearly see the cause and effect analysis and also problem solving. The vector graphic diagrams produced using this solution can be used in whitepapers, presentations, datasheets, posters, and published technical material.

Data Flow Diagram Model

The DFD (Yourdon and Coad notation) example "Model of small traditional production enterprise" below was created using the ConceptDraw PRO diagramming and vector drawing software extended with the Data Flow Diagrams solution from the Software Development area of ConceptDraw Solution Park.

Material Requisition Flowchart. Flowchart Examples

Create your own material requisition flow charts using the ConceptDraw PRO diagramming and vector drawing software extended with the Flowcharts solution from the Diagrams area of ConceptDraw Solution Park.
The flowchart example shows the material requisition business process.

Data Flow Diagram (DFD)

This example is created using ConceptDraw PRO enhanced with solution Data Flow Diagrams. This diagram shows one of the business processes to simplify and accelerate understanding, analysis, and representation.
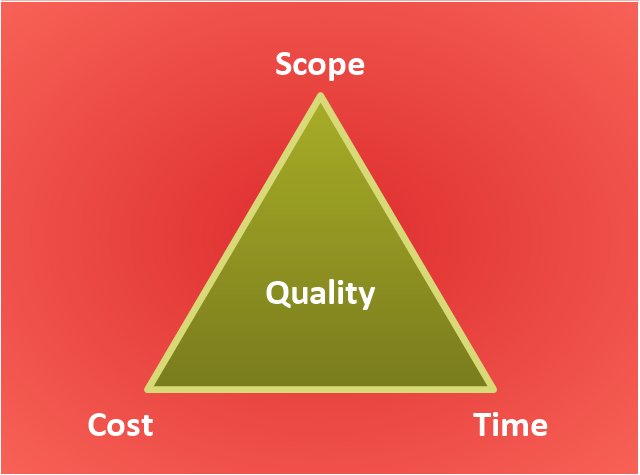
"The Project Management Triangle (called also Triple Constraint or the Iron Triangle) is a model of the constraints of project management. It is a graphic aid where the three attributes show on the corners of the triangle to show opposition. It is useful to help with intentionally choosing project biases, or analyzing the goals of a project. It is used to illustrate that project management success is measured by the project team's ability to manage the project, so that the expected results are produced while managing time and cost." [Project management triangle. Wikipedia]
The pyramid chart example "Project management triangle diagram" was redesigned using the ConceptDraw PRO diagramming and vector drawing software from Wikimedia Commons file Project-triangle-en.svg. [commons.wikimedia.org/ wiki/ File:Project-triangle-en.svg]
The project management triangle chart example is included in the Pyramid Diagrams solution from the Marketing area of ConceptDraw Solution Park.
Pyramid diagram
Pyramid diagram, triangle diagram, triangular diagram, triangle chart, triangular chart, triangle scheme, triangular scheme,

event-driven process chain diagram, EPC diagram, process chain flowchart Event-driven Process Chain Diagrams

event-driven process chain diagram, EPC diagram, process chain flowchart
Event-driven Process Chain (EPC) Diagram is a type of flowchart widely used for modeling in business engineering and reengineering, business process improvement, and analysis. EPC method was developed within the Architecture of Integrated Information Systems (ARIS) framework.

Fishbone Problem Solving

The knowledge and ability to apply various strategies for dealing with problems and difficult situations is very useful in many areas. The Fishbone strategy is one of the most progressive. This graphical technique helps to identify possible causes of problems, to set the goals, and also show internal connections between the different parts of problem. After reviewing all causes and facts, you can easily find right solution.
ConceptDraw PRO diagramming and vector drawing software extended with Fishbone Diagrams Solution from the Management Area of ConceptDraw Solution Park is a powerful Fishbone Problem Solving tool.

Pyramid Diagram

The Project Management Triangle Diagram depicts three main constraints of any project: scope, time and cost. Projects have to comply with the specified scope, projects should be finished in time and projects need to consume the budget. Each of the constraints represents one side of the triangle, and any change in budget or timing or scope affects the entire diagram.

Swim Lane Diagrams

Swim Lane diagrams are the variety of process flow diagrams and are based on the IDEF3 standard. They were developed by Lynn Shostack for usage in projecting. With their help organization diagrams are combined with process flow, as they visually display an object of the production system which is charged with given concrete processes in general flow of processes of the production system.

Data Flow Diagram Examples

You need to draw the Data Flow Diagram? Use ConceptDraw PRO diagramming and vector drawing software extended with Data Flow Diagrams solution from the Software Development area of ConceptDraw Solution Park.The Data Flow Diagrams solution provides a numerous collection of Data Flow Diagram examples created according to Gane and Sarson, and Yourdon and Coad notations using the ConceptDraw PRO software.