SSADM Diagram
The vector stencils library SSADM from the solution Systems engineering contains specific symbols of SSADM diagrams for ConceptDraw PRO diagramming and vector drawing software. The Systems engineering solution is contained in Software Development area of ConceptDraw Solution Park. The example below illustrates the waterfall model used in SSADM. This model involves 5 stages of developing a product such as requirements specification and its' analysis, design, coding and testing.Agile Methodology
Agile methodology is an excellent alternative to waterfall and traditional sequential development. ConceptDraw PRO software extended with SCRUM Workflow solution is ideal for quick and easy designing various diagrams, charts, mind maps and schematics illustrating software development using Agile methodologies, and in particular Scrum methodology.Scrum
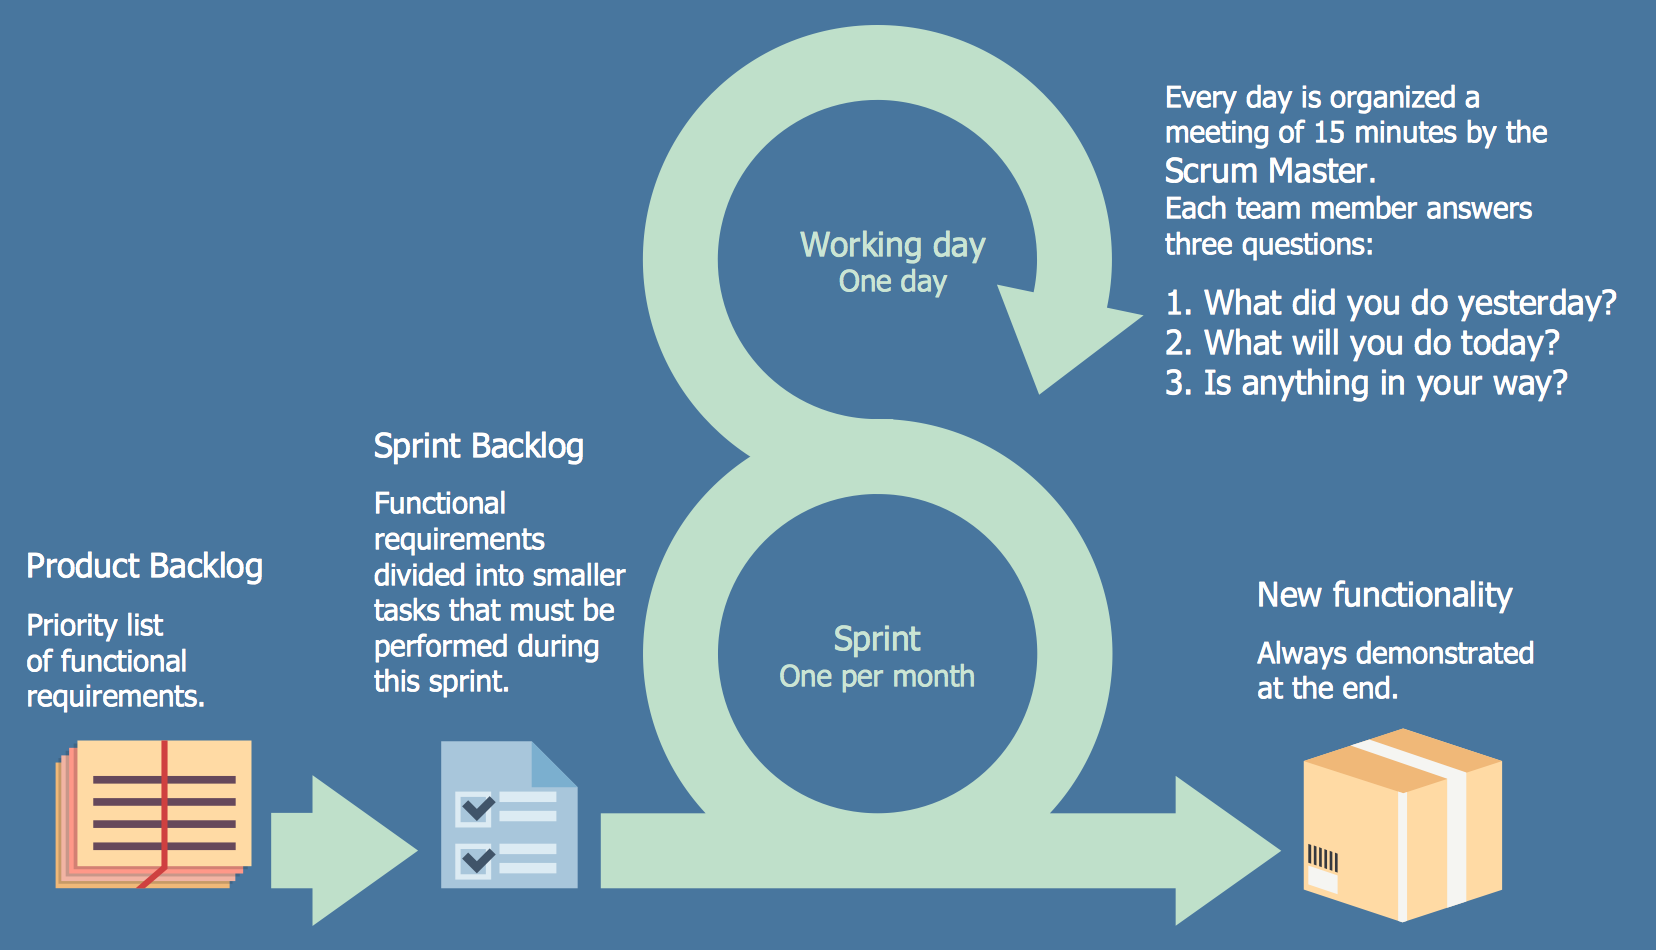
What is Scrum? Scrum is the famous agile software development methodology which depicts an iterative and incremental approach for the work on the complex projects. Use ConceptDraw PRO diagramming and vector drawing software extended with SCRUM Workflow solution to draw various types of professional-looking Scrum Charts, Scrum Workflow Diagrams, Scrum Mind Maps, Scrum boards and attractive Scrum Infographics.Scrum process work items and workflow
Teams working with Scrum methodology use the product backlog items (PBIs), bug work item types (WITs), reports and dashboards. SCRUM Workflow solution for ConceptDraw PRO software offers collection of samples, variety of predesigned objects, clipart and graphic elements, a set of Scrum process work items and workflow which are developed for agile teams working using Scrum.How To Create a Workflow Diagram
A workflow diagram is less general notation than a process flow diagram. Workflow as a term can apply to organizational process which involves people, resources, documents, sort of data, for instance; whereas a process is general collection of steps occuring in any sort of activity. That is why process flow diagram can be used as workflow diagram to describe business process, data flow or department interactions. The fastest way to create a workflow diagram is using pre-designed workflow template. ConceptDraw PRO with the Workflow Diagrams solution delivers rich set of workflow diagram templates you may start from.Program to Make Flow Chart
Use ConceptDraw PRO diagramming and business graphics software for drawing your own PM life cycle flow charts.Org Chart Diagram
ConceptDraw Office products and PM solutions included to ConceptDraw Solution Park support many project methodologies, among them Agile and Simple Projects, which help in implementing the best practices in project management. ConceptDraw Office applications give effective support in solving the issues related with planning, tracking, events, milestones, resource usage, and many other project management functions. ConceptDraw MINDMAP software provides the great advantages of a Mind Map hierarchical tree structure during the process of development the organizational structure of an organization. When you need to make the Organizational Chart, you can use any ConceptDraw PRO or ConceptDraw MINDMAP software. If you already have a designed Mind Map, it is incredibly easy to generate an Organizational Chart directly from ConceptDraw MINDMAP. You need simply double-click the corresponding icon, all the rest will be made automatically. The Organizational Chart will be created from the active page of your map, outputted to ConceptDraw PRO and opened in Slideshow mode.Scrum workflow
ConceptDraw PRO diagramming and vector drawing software extended with unique SCRUM Workflow solution from the Project Management area of ConceptDraw Solution Park allows fast and easy design professional-looking Scrum Workflow Diagrams and Scrum workflow scheme for projects required when working on projects and managing them, when developing software with cutting-edge Agile methodologies.Use Case Diagrams technology with ConceptDraw PRO
Use case diagrams are used at the development of software and systems for definition of functional system requirements or system of systems. Use case diagram presents the consecution of object’s actions (user’s or system’s) which are executed for reaching the definite result.IT Security Solutions
Dynamic of development computer and network technologies increases the need in modern cyber security strategies and IT security solutions to support security of your data, to ensure data privacy, and to protect your operations from the cyber threats. Thanks to the Network Security Diagrams Solution from the Computer and Networks Area of ConceptDraw Solution Park, the ConceptDraw PRO diagramming and vector drawing software is one of the unique IT security solutions for professional designing Network Security Diagrams.Value stream with ConceptDraw PRO
The Value stream is a totality of all actions on the projection, order composition and production: starting from creation a product project to launching this product, from order to delivery, from extraction of raw materials to ready product manufacturing. Value stream mapping is a process of visualization of these actions and creation of a detailed and graphical map.WBS Diagram
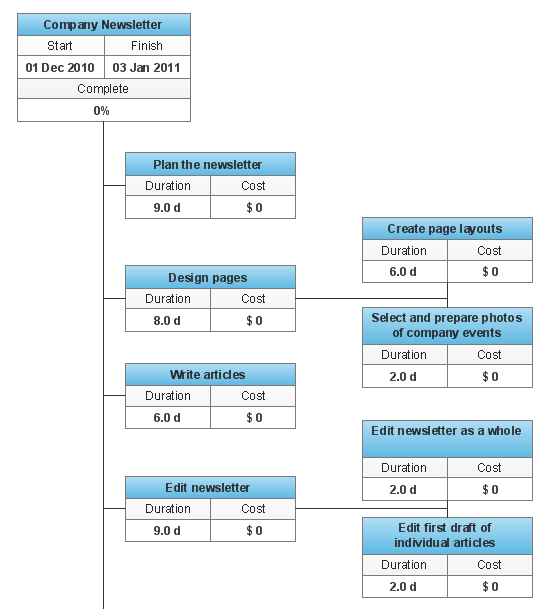
To simplify the managing of a complex project, it is advisable to divide it into the components in a hierarchical tree structure, called by Work Breakdown Structure (WBS). WBS diagram clearly divides all the works and tasks that must be done to achieve the objectives of the project, into the smaller operations and actions. Such division of the project accelerates the allocation of resources and establishes the areas of responsibility for each team member. WBS diagram is one of the main planning tools frequently used by project managers, it allows you to clearly define the entire scope of work on the project, to describe in details the content of these works and to arrange them in a form of hierarchical structure. The better you detailing the WBS, the more accurate will be all actions. The optimal size of elements is from the few days to several months. ConceptDraw Office suite applications and ConceptDraw Solution Park contain a lot of tools actively applied in project management, in their quantity is included the possibility of easy creation professional-looking Work Breakdown Structure (WBS) diagrams.
 Scrum Workflow
The Scrum Workflow Solution extends the capabilities of ConceptDraw PRO 10 with a large collection of professionally-designed samples and a selection of ready-to-use scrum design elements: scrum diagrams and arrows, scrum icons of people, artifacts, workflow, workspace and other colorful scrum clipart, and also scrum charts.
How to draw Metro Map style infographics? Moscow, New York, Los Angeles, London
The solution handles designs of any complexity, and the comprehensive library covers all key aspects of a transportation system. To further enhance your map design, there is the option to embed links, that can display station images or other relevant, important information. We have also included a set of samples in the solution, that show the possible real-world application — complex tube systems including the London Tube and New York City Subway show the level of detail possible when using the Metro Map Solution.Donut Chart Templates
These donut chart templates was designed using ConceptDraw PRO diagramming and vector drawing software extended with Pie Charts solution from Graphs and Charts area of ConceptDraw Solution Park. All these donut chart templates are included in the Pie Charts solution. You can quickly rework these examples into your own charts by simply changing displayed data, title and legend texts.- Basic Flowchart Symbols and Meaning | Agile Methodology | Scrum ...
- Scrum Workflow | Scrum process work items and workflow | Kanban ...
- Waterfall Method Example
- Process Flowchart | Sales Process Flowchart . Flowchart Examples ...
- Methodology Diagram Template
- Flowchart Software | Contoh Flowchart | Sales Flowcharts | Example ...
- Sample Pictorial Chart. Sample Infographics | Basic Flowchart ...
- Scrum process work items and workflow | Agile Methodology | Linux ...
- How to Connect an Image to a Topic in Your Mind Map | Scrum ...
- Basic Flowchart Symbols and Meaning | Process Flowchart | Agile ...
- Design elements - Scrum charts | PM Agile | How to Create a ...
- Systems development life cycle | SSADM Diagram | Process ...
- Scrum | Scrum workflow | Scrum board | Scrum Guide
- Types of Flowchart - Overview | Flowchart on Bank. Flowchart ...
- Example of DFD for Online Store (Data Flow Diagram ) DFD ...
- Process Flowchart | Types of Flowcharts | Basic Flowchart Symbols ...
- Physics Diagrams | Process Flow Chart Symbols | ConceptDraw ...
- Renewable energy | Scrum workspace | Recycle Chart Image
- Marketing and Sales Organization chart . Organization chart Example


