Example Process Flow

Waterfall Bar Chart

SSADM Diagram

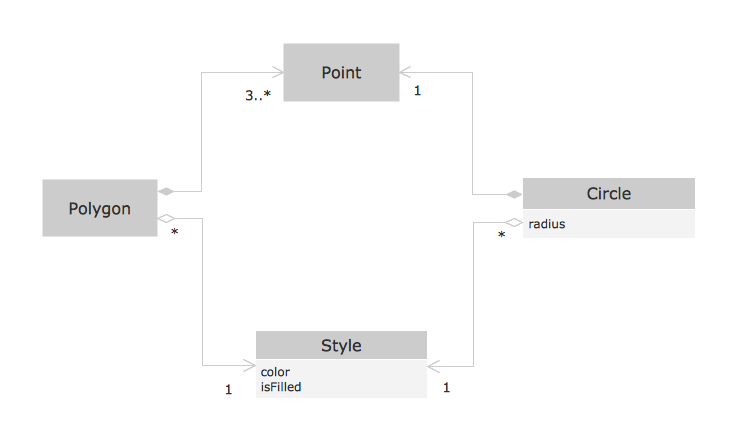
OOSE Method
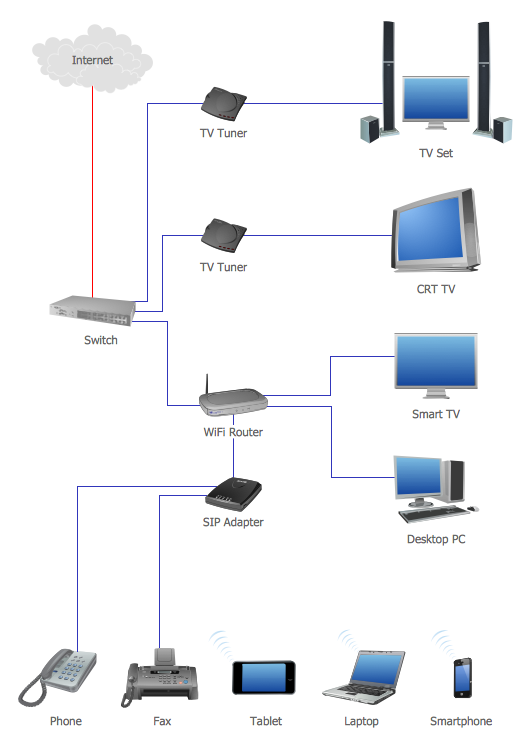
Network Topology Graphical Examples
Fishbone Diagram Problem Solving

Booch OOD Diagram

Agile Methodology

Data Flow Diagram

Gane Sarson Diagram

- ConceptDraw PRO DFD Software | Waterfall Model Dfd
- ConceptDraw PRO DFD Software | Waterfall Model Of The Ssadm
- Waterfall Model For Library Management System Ppt
- Agile Scrum Waterfall Methodology
- Information Systems Waterfall Model With Dfd
- Examples for OOSE Method | OOSE Method | Waterfall Bar Chart ...
- SSADM Diagram | Waterfall Bar Chart | Best Program to Make ...
- Structured Systems Analysis and Design Method (SSADM) with ...
- Agile Methodology | SSADM Diagram | Basic Flowchart Symbols ...