Construction Project Chart Examples
ConceptDraw PROJECT provides a set of construction Gantt chart examples. Project manager requires task tracking, and project examples best approach to start. Make your project applying one of our ready-made examples.How to Report Task's Execution with Gantt Chart
ConceptDraw PROJECT’s powerful reporting engine lets you generate a set of tabular reports with just one click, or visualize your project as Radial Tasks Structures, Work Breakdown Structures and Resource Calendars. It also provides you with dynamic Project Dashboards.Process Flow Chart
A Process Flow Chart is a type of flowchart which is mostly used in industrial, chemical and process engineering for illustrating high-level processes, major plant processes and not shows minor details. ConceptDraw DIAGRAM diagramming and vector drawing software extended with Flowcharts Solution from the "Diagrams" Area of ConceptDraw Solution Park is the best way to create Process Flow Chart and other types of flowcharts.Word Exchange
ConceptDraw MINDMAP is a powerful application for creating best-looking and quality Mind Maps. Sometimes besides the brainstorming, mind mapping and drawing tools, you may need the functions of collaboration and exchange information between different applications. Such opportunity makes you flexible in exchange of information and documents with colleagues and other people. ConceptDraw Solution Park offers the Word Exchange solution at the Business Productivity area, specially developed for making the MS Word documents from your Mind Maps with just a simple click of mouse. Now, it is simple to make in ConceptDraw MINDMAP the framework for a future article or book, to fill a structure with ideas and then easy receive MS Word document. And vice versa, you are able to load any MS Word document into Mind Map to review, refine, discuss, and present the structure and story. MINDMAP Word exchange is indispensable for lecturers, writers, journalists, bloggers, copywriters, and other people who need easy create, review and organize text documents, structure and edit articles or books, present a brief contents.How To Use Enterprise Collaboration Software
Enterprise collaboration software helps to facilitate action-oriented teams working together over geographic distances by providing tools that aids on communication, collaboration process and problem solving.
Personal area (PAN) networks. Computer and Network Examples
Personal area network (PAN) is a network organized on a limited area and used for data transmission between various personal devices, such as computers, tablets, laptops, telephones, different digital and mobile devices, etc. and also for connecting to higher level network and Internet. PAN is used to manage the interconnections of IT devices which surround a single user and generally contains such appliances, as cordless mice, keyboard, phone, and Bluetooth handsets. PANs can be wired with computer buses, or wirelessly connected to the Internet using such network technologies as Bluetooth, Z-Wave, ZigBee, IrDa, UWB, Body Area Network. PANs have a lot of pros and cons, they are expedient, lucrative and handy, but sometimes have bad connection with other networks on the same radio bands, Bluetooth has distance limits and slow data transfer speed, but is comparatively safe. ConceptDraw DIAGRAM diagramming software supplied with numerous solutions of Computer and Networks Area included to ConceptDraw Solution Park perfectly suits for designing the Personal Area Networks.
Bar Diagrams for Problem Solving. Create economics and financial bar charts with Bar Graphs Solution
Create bar graphs for visualizing economics problem solving and financial data comparison using the ConceptDraw DIAGRAM diagramming and vector drawing software extended with the Bar Graphs Solution from the Graphs and Charts area of ConceptDraw Solition Park.How to make great presentation via Skype? ...how it works with ConceptDraw MINDMAP?
ConceptDraw Solution Park provides a lot of useful solutions, among them Remote Presentation for Skype solution and powerful Mind Map Exchange solution. The presentation via Skype conference call is a part of Remote Presentation for Skype solution, due to it you are able to share easily your presentation via Skype and to control the slide-show process, which plays synchronously on the computers of all conference call participants. The Mind Map Exchange solution provides a lot of features for importing and exporting the documents between ConceptDraw MINDMAP software and the most popular mindmapping software tools, such as MindJet Mindmanager, Freemind, XMind and others. Thanks to all these abilities the ConceptDraw MINDMAP mind mapping software is perfect for holding the remote learning, remote training, varied web conferences, webinars and team briefings, and to represent any kind of information in a simple and convenient Mind Map form. With ConceptDraw MINDMAP it is easy to deliver the presentation session via Skype and to share the great-looking presentation documents with each conference participant.Basic Audit Flowchart. Flowchart Examples
This sample shows the Audit Process Flowchart. It was created in ConceptDraw DIAGRAM diagramming and vector drawing software using the Flowcharts solution from the Diagrams area of ConceptDraw Solution Park. The Audit Flowcharts are widely used in the financial management, accounting, money management and in many others fields.Product Overview
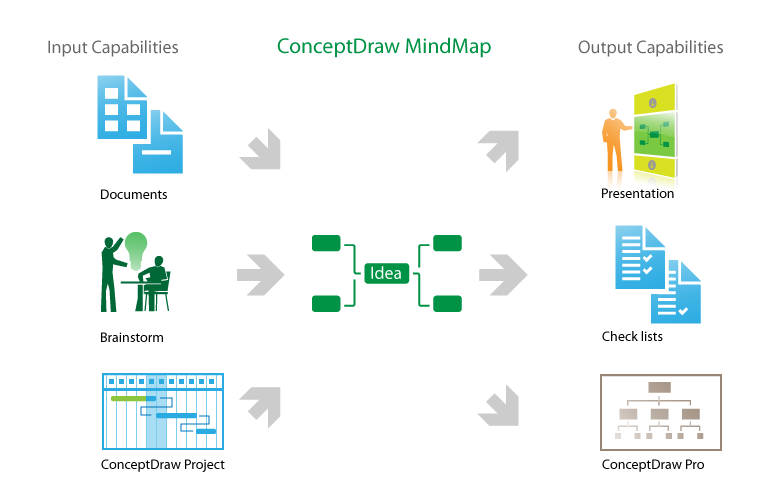
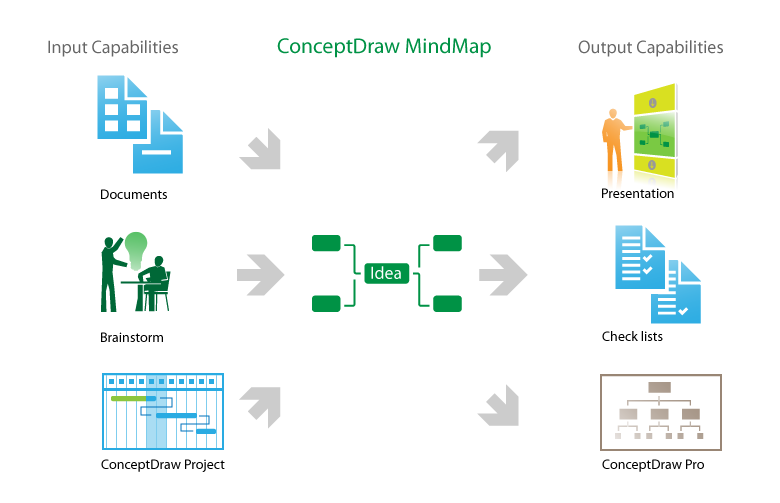
The role of ConceptDraw MINDMAP is to organize and plan idea development and communicate between process participants. Mind maps are convenient to prepare presentations for team and management and send task lists and related information.Process Flow Chart Examples
Process Flow Chart is a visual illustration of overall flow of activities in producing a product or service. How do you make a Process Flow Chart usually? Drawing process flow charts, diagrams and maps is quite complex and lengthy process, especially if you draw free-hand. But now thanks to the ConceptDraw DIAGRAM diagramming and vector drawing software extended with Flowcharts solution from the "Diagrams" area of ConceptDraw Solution Park this process became simple and fast. A confirmation of this can serve many Process Flow Chart examples included in Flowcharts solution.Functional Flow Block Diagram
You need to draw a Functional Flow Block Diagram? You are an artist? Now it doesn't matter. With Block Diagrams solution from the "Diagrams" area for ConceptDraw Solution Park you don't need more to be an artist to design the Functional Flow Block Diagram of any complexity.Process Flow Chart Symbols
Process Flow Chart is a visual diagram which shows the processes and relationships between the major components in a system, and uses for this the special process flow chart symbols: special shapes to represent different types of actions and process steps, lines and arrows to represent relationships and sequence of steps. It often named process flow diagram, it use colored flowchart symbols. It is incredibly convenient to use the ConceptDraw DIAGRAM software extended with Flowcharts Solution from the "Diagrams" Area of ConceptDraw Solution Park for designing professional looking Process Flow Charts.
 PM Docs
PM Docs solution from ConceptDraw Solution Park extends ConceptDraw MINDMAP software with the ability to create and organize the project and company documentation, to structure information that relates to your project, to link the project documentation to tasks, phases, and resources. This solution contributes for improvement the project management abilities and enhancement the productivity of project team, makes it easier to locate the pertinent documentation over the life of a project, beginning from its planning, improves the document access and minimizes search time, lets to link or embed documentation into the project topics, helps create document, design professional Mind Maps, link the correct documents to keep them organized in a project, sort the project documents and visually differentiate the document types.
 PM Response
The PM Response solution extends the functional abilities in project management for all three ConceptDraw products by helping to improve the response time to project changes, to plan on how to effectively respond on issues and events impacting the project. It supplies the project managers, team leaders, and all other project participants with wide abilities of iteration planning, creative collaboration, effective decision-making, discussions of the project layout approaches and solving the project challenges, lets them use mind mapping technique for iteration planning and applying the project changes, to represent the projects data as Mind Maps and use them to construct the clear plans, to convert project maps to project implementations, to use different kinds of Visual diagrams to solve the current project problems and to make correct decisions, to plan resources usage and to respond to changes in the project environment.
Network Diagram Software
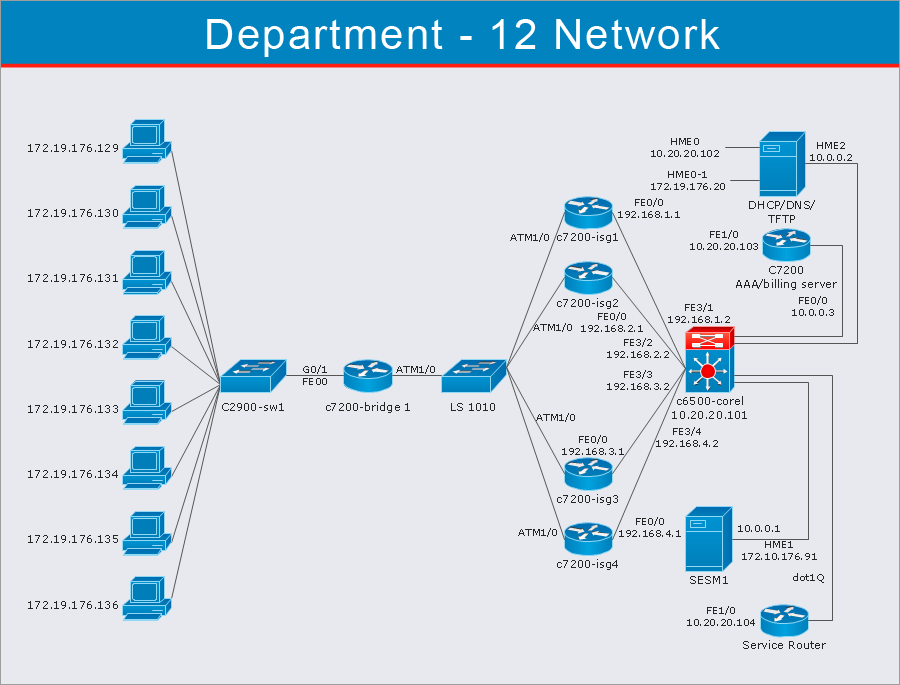
ConceptDraw Network Diagram Software - Network design software for network drawings with abundant examples and templates. Create computer network designs, diagrams and schematics using ConceptDraw.
Flowchart
The Flowcharts are widespread in various fields and include the multitude of types. They are dedicated to representation the algorithms, processes, workflows of any complexity in a clear and intuitive format. The Flowcharts are commonly used in software development as a visual tool for illustration algorithms and logic of computer programs, in business for illustration business scenarios, in education, and so on. For drawing the Flowchart are used the special object blocks, among them rectangle or box used to represent an activity or step, rounded box or oval to depict Start / End, diamond to represent the decision point (involves the branching yes/no), circle used to represent the point of connection, parallelogram to represent the Input / Output, and some others. With ConceptDraw DIAGRAM including Flowcharts solution it is easy to create professional-looking Flowchart diagrams of any complexity and any degree of detailing. Succeed in drawing the Flowcharts using quick-start templates, predesigned samples and extensive libraries of ready-made flowchart symbols, blocks and icons.Pyramid Diagram
Triangle diagram example of DIKW pyramid has 4 levels: data, information, knowledge and wisdom.Business Process Modeling Software for Mac
ConceptDraw DIAGRAM - business process modeling software for mac offers the Business Process Diagram Solution with powerful tools to help you easy represent the business processes and create the business process diagrams based on BPMN 1.2 and BPMN 2.0 standards that allows to create of both simple and complex (nested) models of processes.How to Create a Social Media DFD Flowchart
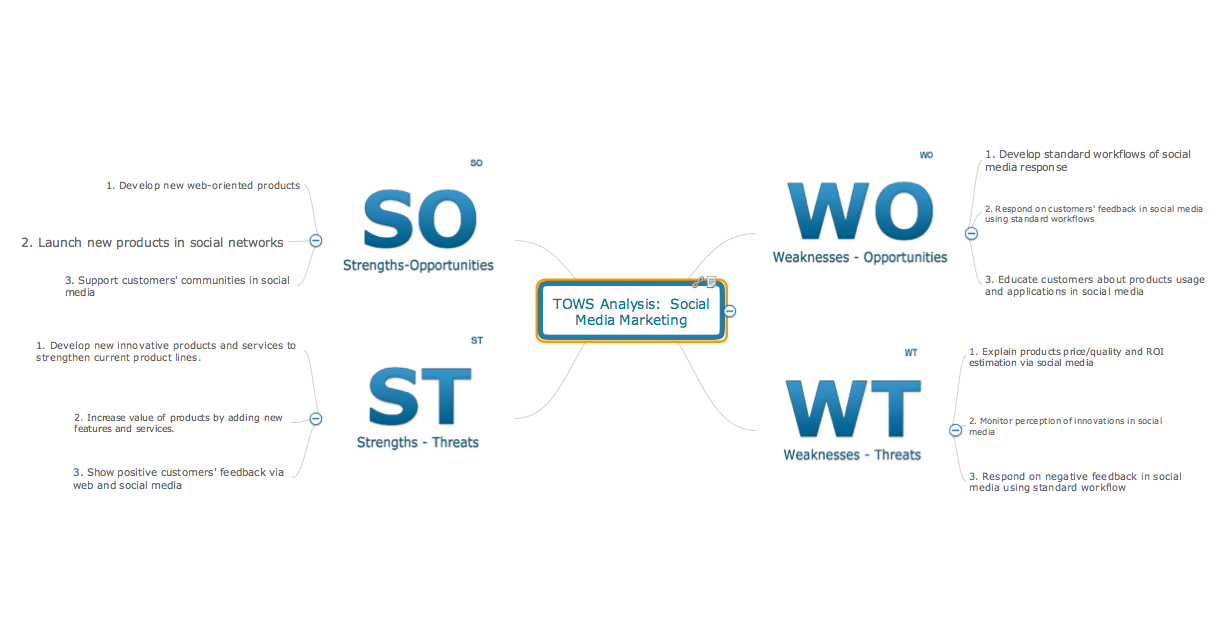
The use of social media in modern conditions helps the companies to be more effective in timely messaging - actively and rapidly response to a customer posts in social media, to find quickly the appropriate response to social media mentions, to save greatly the budget. Many companies even use the social media as a lead tool for promotion. But how to create a Social Media DFD Flowchart, Social Media Response Flowchart or Action Mind Map fast and easy? ConceptDraw DIAGRAM ector graphical software and Social Media Response solution included to ConceptDraw Solution Park assist greatly in their creation. This solution improves the quality of content in social media and helps to build an active customer community. The samples and examples included to Social Media Response solution are helpful for social media teams in developing a social media strategy, in refining and organizing the response process, in creation training materials by trainers and consultants for education the social media groups on how to accomplish the most effectiveness in their daily work.- Gantt chart examples
- Gant Chart in Project Management | What is Gantt Chart (historical ...
- Gantt charts for planning and scheduling projects | Project ...
- Convert Gantt Chart To Pert Chart
- How to Create a Gantt Chart for Your Project | Business diagrams ...
- How to Discover Critical Path on a Gantt Chart | PERT Chart ...
- Discuss Difference Between The Gantt Chart And Timeline
- Gantt Chart Software | How to Create a Gantt Chart for Your Project ...
- Gantt Chart And Pert Chart In Software Engineering With Example
- Gantt chart examples
- Process Flowchart | Sample Project Flowchart. Flowchart Examples ...
- Flowcharts | Make Use Of Appropriate Graphics Or Sketches To ...
- Gant Chart in Project Management | Examples of Flowcharts, Org ...
- Tree Network Topology Diagram | Hierarchical Network Topology ...
- How to Draw a Gantt Chart Using ConceptDraw PRO | How to ...
- Picture Graphs | Divided Bar Diagrams | Flow Map | Make Use Of ...
- Decision Making | Business Process Modeling Software for Mac ...
- Gantt charts for planning and scheduling projects | Product Overview ...
- Electrical Symbols, Electrical Diagram Symbols | Electrical Drawing ...
- Business and Finance Illustrations Example | Network Diagram ...


