ERD Symbols and Meanings


Entity Relationship Diagram Software Engineering

ER Diagram Tool

Developing Entity Relationship Diagrams

E-R Diagrams

Entity Relationship Diagram Software for Mac

Entity Relationship Diagram Software

Multi Layer Venn Diagram. Venn Diagram Example

Entity Relationship Diagram - ERD - Software for Design Crows Foot ER Diagrams
_Win_Mac.png "Entity Relationship Diagram - ERD - Software for Design <br>Crows Foot ER Diagrams *")
This example was designed on the base of Wikimedia Commons file: Example ERD2.png.
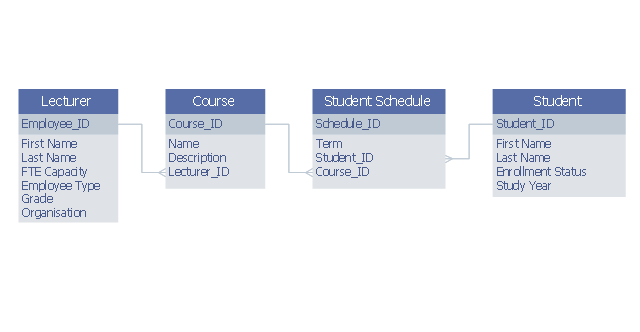
"example entity relationship diagram showing relationship between lecturers and students" [commons.wikimedia.org/ wiki/ File:Example_ ERD2.png]
This file is licensed under the Creative Commons Attribution-Share Alike 3.0 Unported license. [creativecommons.org/ licenses/ by-sa/ 3.0/ deed.en]
"Relationship diagrams (also known as logical data models) are used to design relational databases and can be a good way of understanding the structures in a data set. The 3 building blocks of an Entity Relationship model are entities, attributes and relationships. An entity is a discrete and recognisable 'thing', either a pysical object ..., or concept ... Each entity can be physically represented as a table, where each column of the table is an attribute of the entity ... A relationship is a verb that links two or more entities. ... Importantly, relationships also have a cardinality that can be 'one to one', 'many to one', 'one to many' or 'many to many'. ... Many to many relationships are often a sign that a design needs to be further elaborated. For example the 'teaches' relationship between teachers and students at a university would be many to many and would require the introduction of entities like class and date to fully understand the relationship." [en.wikibooks.org/ wiki/ Data_ Science:_ An_ Introduction/ Thinking_ Like_ a_ Data_ Engineer]
The entity-relationship diagram example "Lecturers-students relationship ERD" was drawn using ConceptDraw PRO software extended with the Entity-Relationship Diagram (ERD) solution from the Software Development area of ConceptDraw Solution Park.
Entity-relationship diagram
Property Management Examples

Notation & Symbols for ERD

Business Process Mapping — How to Map a Work Process

ConceptDraw DIAGRAM Database Modeling Software

Diagramming Software for Design UML Timing Diagrams


IDEF1 standard

Venn Diagram Examples for Problem Solving

Best Vector Drawing Application for Mac OS X

Ice Hockey Diagram – Deke Technique

Express-G Diagram

- Entity-Relationship Diagram | ERD Symbols and Meanings ...
- Entity Relationship Diagram - ERD - Software for Design Crows Foot ...
- ERD Symbols and Meanings | Entity Relationship Diagram Symbols ...
- Entity Relationship Diagram Symbols | Martin ERD Diagram ...
- Data Flow Diagrams (DFD) | Entity-Relationship Diagram ( ERD ...
- Entity-Relationship Diagram ( ERD ) | Order process - BPMN 2.0 ...
- Food Court | Entity-Relationship Diagram ( ERD ) | Entity ...
- Design elements - ER diagram (Chen notation) | Databases Access ...
- Entity-Relationship Diagram ( ERD ) | Network Diagram Software ...
- Crows Foot Erd Diagram Exercises With Answer
- UML component diagram - Start server | Components of ER ...
- Entity-Relationship Diagram ( ERD ) | Event-driven Process Chain ...
- Entity-Relationship Diagram ( ERD ) | IDEF1X Standard | PM ...
- Design elements - Aircraft | Entity-Relationship Diagram ( ERD ...
- Entity Relationship Diagram - ERD - Software for Design Crows Foot ...
- Entity-Relationship Diagram ( ERD ) | Flowcharts | Office Layout ...
- Er Diagram Hr Recruitment Process
- Entity-Relationship Diagram ( ERD ) | Flowcharts | Dfd Of Online ...
- HR Flowcharts | Flowcharts | ATM UML Diagrams | Er Diagram For ...