The vector stencils library "Logical network diagram" contains 16 symbols for drawing logical computer network diagrams.
"The logical topology ... is the way that the signals act on the network media, or the way that the data passes through the network from one device to the next without regard to the physical interconnection of the devices. A network's logical topology is not necessarily the same as its physical topology. ...
The logical classification of network topologies generally follows the same classifications as those in the physical classifications of network topologies but describes the path that the data takes between nodes being used as opposed to the actual physical connections between nodes. The logical topologies are generally determined by network protocols as opposed to being determined by the physical layout of cables, wires, and network devices or by the flow of the electrical signals, although in many cases the paths that the electrical signals take between nodes may closely match the logical flow of data, hence the convention of using the terms logical topology and signal topology interchangeably.
Logical topologies are often closely associated with Media Access Control methods and protocols. Logical topologies are able to be dynamically reconfigured by special types of equipment such as routers and switches." [Network topology. Wikipedia]
The symbols example "Logical network diagram - Vector stencils library" was created using the ConceptDraw PRO diagramming and vector drawing software extended with the Computer and Networks solution from the Computer and Networks area of ConceptDraw Solution Park.
www.conceptdraw.com/ solution-park/ computer-and-networks
Server
Disk
Printer
Domain

Network
File

Group
Root
Shared Admin

Directory

Tree
NDS Container
Unknown

Neightborhood

Service

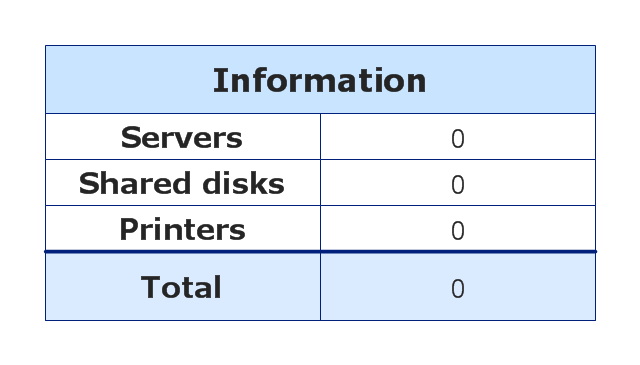
Information
Network Topologies


The vector stencils library "Cisco LAN" contains 23 symbols of local area network (LAN) devices and equipment for drawing Cisco LAN topology diagrams.
"Network topology describes the layout of interconnections between devices and network segments. At the Data Link Layer and Physical Layer, a wide variety of LAN topologies have been used, including ring, bus, mesh and star, but the most common LAN topology in use today is switched Ethernet. At the higher layers, the Internet Protocol (TCP/ IP) has become the standard, replacing NetBEUI, IPX/ SPX, AppleTalk and others.
Simple LANs generally consist of one or more switches. A switch can be connected to a router, cable modem, or ADSL modem for Internet access. Complex LANs are characterized by their use of redundant links with switches using the spanning tree protocol to prevent loops, their ability to manage differing traffic types via quality of service (QoS), and to segregate traffic with VLANs. A LAN can include a wide variety of network devices such as switches, firewalls, routers, load balancers, and sensors.
LANs can maintain connections with other LANs via leased lines, leased services, or the Internet using virtual private network technologies. Depending on how the connections are established and secured in a LAN, and the distance involved, a LAN may also be classified as a metropolitan area network (MAN) or a wide area network (WAN)." [Local area network. Wikipedia]
The symbols example "Cisco LAN - Vector stencils library" was created using the ConceptDraw PRO diagramming and vector drawing software extended with the Cisco Network Diagrams solution from the Computer and Networks area of ConceptDraw Solution Park.
www.conceptdraw.com/ solution-park/ computer-networks-cisco
Sun workstation
Workstation
PC
Macintosh
Terminal
Mini VAX
Printer
Laptop
File server
Monitor
Web cluster
ATM fast gigabit etherswitch
HP Mini
Supercomputer
LAN2LAN
LAN to LAN
Web server
Web browser
Repeater
PDA
General appliance
PC, blue
Mini VAX, blue
Stakeholder Onion Diagrams

 Marketing Diagrams
Marketing Diagrams solution extends ConceptDraw DIAGRAM diagramming software with abundance of samples, templates and vector design elements intended for easy graphical visualization and drawing different types of Marketing diagrams and graphs, including Branding Strategies Diagram, Five Forces Model Diagram, Decision Tree Diagram, Puzzle Diagram, Step Diagram, Process Chart, Strategy Map, Funnel Diagram, Value Chain Diagram, Ladder of Customer Loyalty Diagram, Leaky Bucket Diagram, Promotional Mix Diagram, Service-Goods Continuum Diagram, Six Markets Model Diagram, Sources of Customer Satisfaction Diagram, etc. Analyze effectively the marketing activity of your company and apply the optimal marketing methods with ConceptDraw DIAGRAM software.
, t chart, decision matrix, decision tree analysis") Decision Making
Decision Making
The Decision Making solution offers the set of professionally developed examples, powerful drawing tools and a wide range of libraries with specific ready-made vector decision icons, decision pictograms, decision flowchart elements, decision tree icons, decision signs arrows, and callouts, allowing the decision maker (even without drawing and design skills) to easily construct Decision diagrams, Business decision maps, Decision flowcharts, Decision trees, Decision matrix, T Chart, Influence diagrams, which are powerful in questions of decision making, holding decision tree analysis and Analytic Hierarchy Process (AHP), visual decomposition the decision problem into hierarchy of easily comprehensible sub-problems and solving them without any efforts.
 Object-Role Modeling (ORM) Diagrams
Object-role Modeling (ORM) Diagram solution with powerful vector diagramming and data modeling tools, large quantity of specially developed samples and examples, and rich variety of vector objects corresponding to common ORM notation, ideally suits for developing the comprehensive, clear and visual Object-role Modeling (ORM) diagrams and schematics, understandable for all interested people from the different fields and business directions, for designing the ORM models, and demonstrating advantages from the use of ORM and its notation. It is intended for software developers and computer engineers, specialists in a field of Object-oriented programming (OOP), database architects, web-application constructors and developers, etc.
Examples of Flowcharts, Org Charts and More


 Tilt and Turn Windows
Tilt and Turn Windows solution provides professional tools and ready-to-use vector design objects making the process of window design simple and comfortable, allowing easily model the windows constructions, to draw the sketches and schematics of windows, to create detailed drawings of window designs combining different types of sashes, designing the tilt inward and outward windows, single, double window or multi-panel windows, single hung window, double hung window, and many other window types with depiction of sizes and types of turn constructions.
 Aerospace and Transport
This solution extends ConceptDraw DIAGRAM software with templates, samples and library of vector clipart for drawing the Aerospace and Transport Illustrations. It contains clipart of aerospace objects and transportation vehicles, office buildings and anci
 Medical Illustrations
Medical Illustrations solution including the set of professionally developed examples and samples dedicated to medicine, large variety of ready-to-use vector objects and icons of diagnostic equipment, treatment equipment, medical instruments, tools and devices, medical professionals and health workers of different medical specialties, medical procedures and patients, medical pictograms and medical symbols, among which are the famous red cross symbol, heartbeat symbol, doctor symbol, and many others, is a perfect help in questions of medical illustration and medical imaging, creation professional-looking, colorful and attractive Medical illustrations, Medical diagrams and infographics, slides for presentations in a field of medicine and health care, depicting the medical facts, the information about varied diseases and ways of medical diagnosis, methods of prevention and treatment diseases.
Concept Maps

 GHS Hazard Pictograms
GHS Hazard Pictograms solution contains the set of predesigned standard GHS pictograms, Hazardous symbols, and Hazard communication pictograms, approved and agreed by UN in Globally Harmonized System of Classification and Labelling of Chemicals (GHS). They can be used for quick and simple designing accurate and professional-looking infographics, diagrams, warning announcements, signboards, posters, precautionary declarations, regulatory documents, and for representing the main items of OSHA HAZCOM Standard.
 Cloud Computing Diagrams
The Cloud Computing Diagrams solution extends the functionality of the ConceptDraw DIAGRAM diagramming software with a comprehensive collection of libraries of commonly accepted cloud computing vector stencils to help you to get started designing Cloud Computing Diagrams, Architecture Diagrams and Cloud Computing Architecture Diagrams without effort. This solution lets one professionally depict the way how the cloud computing works, allows giving a powerful introduction to the Cloud computing architecture and Amazon cloud computing architecture, to display the essence of the cloud computing, the main characteristics and classification of the cloud services thanks to the wide variety of predesigned samples and examples.
Looking at ConceptDraw MINDMAP as a Replacement for Mindjet Mindmanager

PDPC

Process Flowchart


Pyramid Diagram

Pyramid Diagram

CORRECTIVE ACTIONS PLANNING. Risk Diagram (PDPC)
 *")

- Draw The Tree Diagrame In Classification Of Computer Its Types
- Draw A Diagram Showing Classification Of Computer
- Draw Classification Of Computer
- Draw Classification Computer
- Types Of Weldings Tree Diagrams
- Classification Of Computer Memory Tree Diagram
- Welding Tree Diagram
- Classsification Of Welding With Tree Diagram
- Welding Types Tree Diagram
- Tree Diagram Classification Of A Welding Process
- Computer Network Diagrams | Draw A Mind Classification Of ...
- Fault Tree Analysis Diagrams | Tree Network Topology Diagram ...
- Computer Network Diagrams | Logical network diagram - Vector ...
- Draw The Classification Chart Of Computers
- Business Process Modeling Resume | How To Create Root Cause ...
- Show The Tree Diagram Computer Software
- Example of DFD for Online Store (Data Flow Diagram ) | Business ...
- Network Drawing Software | Draw Hierarchy In Computer
- Rapid UML | SYSML | Computer Parts Name Charts For 10 Class