Hotel Network Topology Diagram


This hotel computer reservations system cycle process chart example was redesigned from the Wikimedia Commons file: По-запросу.jpg.
[commons.wikimedia.org/ wiki/ File:По-запросу.jpg]
"A computer reservations system or central reservation system (CRS) is a computerized system used to store and retrieve information and conduct transactions related to air travel, hotels, car rental, or activities. ...
Modern GDSes typically allow users to book hotel rooms, rental cars, airline tickets as well as activities and tours." [en.wikipedia.org/ wiki/ Computer_ reservations_ system]
The cycle process diagram example "Hotel reservation system" was created using the ConceptDraw PRO diagramming and vector drawing software extended with the Sales Flowcharts solution from the Marketing area of ConceptDraw Solution Park.
Hotel computer reservation system - Cycle process diagram

Sales Process Management

It is effective to use professional software for the sales process management. ConceptDraw DIAGRAM diagramming and vector drawing software extended with Sales Flowcharts solution from the Marketing area of ConceptDraw Solution Park is the best choice.
 Sales Flowcharts
The Sales Flowcharts solution lets you create and display sales process maps, sales process workflows, sales steps, the sales process, and anything else involving sales process management.
Conference Planning

Sales Process Flowcharts

This example was redesigned from the Wikipedia file: LastResortHotel BookRoom Process.png. [en.wikipedia.org/ wiki/ File:LastResortHotel_ BookRoom_ Process.png]
This file is licensed under the Creative Commons Attribution-ShareAlike 3.0 License. [creativecommons.org/ licenses/ by-sa/ 3.0/ ]
"Event partitioning is an easy-to-apply systems analysis technique that helps the analyst organize requirements for large systems into a collection of smaller, simpler, minimally-connected, easier-to-understand ‘mini systems’ / use cases. ...
Defining requirements.
Single process in a fictitious hotel using data flow diagram notation.
Single use case in a fictitious hotel using use case diagram notation.
This approach helps the analyst to decompose the system into ‘mentally bite-sized’ mini-systems using events that require a planned response. The level of detail of each response is at the level of ‘primary use cases’. Each planned response may be modelled using DFD notation or as a single use case using use case diagram notation.
The basic flow within a process or use case can usually be described in a relatively small number of steps, often fewer than twenty or thirty, possibly using something like ‘structured English’. Ideally, all of the steps would be visible all at once (often a page or less). The intention is to reduce one of the risks associated with short-term memory, namely, forgetting what is not immediately visible (‘out of sight, out of mind’). ...
Single process in a fictitious hotel using data flow diagram notation." [Event partitioning. Wikipedia]
The DFD example "Last resort hotel book room process" was created using the ConceptDraw PRO diagramming and vector drawing software extended with the Data Flow Diagrams solution from the Software Development area of ConceptDraw Solution Park.
DFD

Structured Systems Analysis and Design Method. SSADM with ConceptDraw DIAGRAM

 Data Flow Diagrams (DFD)
Data Flow Diagrams solution extends ConceptDraw DIAGRAM software with templates, samples and libraries of vector stencils for drawing the data flow diagrams (DFD).
The vector stencils library "Workflow diagrams" contains 54 symbol icons of workflow diagrams.
The workflow diagrams represent information flow, automation of business processes, business process re-engineering, accounting, management, and human resources tasks in industry, business, and manufacturing.
Use this library to draw workflow diagrams in the ConceptDraw PRO diagramming and vector drawing software extended with the Workflow Diagrams solution from the Business Processes area of ConceptDraw Solution Park.
www.conceptdraw.com/ solution-park/ business-process-workflow-diagrams
Accounting

Accounts Payable

Accounts Receivable

Bank

Board of Directors

Copy Center

Customer Service

Distribution

Finance

Information Systems

International Division

International Marketing

International Sales

Inventory

Legal Department

Mailroom 2

Mailroom 1

Management

Manufacturing

Marketing

Motor Pool

Packaging

Payroll

Person 1

Person 2

Personnel/ Staff

Publications

Purchasing

Quality Assurance

Exchange

Reception

Research and Development

Sale contract

Shipping

Suppliers

Telecommunications

Treasurer

Warehouse

Lorry

Quality

Production

Box

Boxes

Open box

Payment

Receiving

Sales

Phone

Operator 1

Online booking

Operator 2

Server

Car

Mini truck

Data Flow Diagram Examples

Basic Flowchart Symbols and Meaning


HR Flowchart Symbols

Types of Flowchart - Overview


Network Security Model

Bar Diagrams for Problem Solving. Create business management bar charts with Bar Graphs Solution

Restaurant Floor Plans Samples

The vector stencils library "Cisco network topology" contains 89 symbols of Cisco network devices and design elements for drawing computer network topology diagrams.
"There are two basic categories of network topologies:
(1) Physical topologies,
(2) Logical topologies.
The shape of the cabling layout used to link devices is called the physical topology of the network. This refers to the layout of cabling, the locations of nodes, and the interconnections between the nodes and the cabling. The physical topology of a network is determined by the capabilities of the network access devices and media, the level of control or fault tolerance desired, and the cost associated with cabling or telecommunications circuits.
The logical topology in contrast, is the way that the signals act on the network media, or the way that the data passes through the network from one device to the next without regard to the physical interconnection of the devices." [Network topology. Wikipedia]
The symbols example "Cisco network topology - Vector stencils library" was created using the ConceptDraw PRO diagramming and vector drawing software extended with the Cisco Network Diagrams solution from the Computer and Networks area of ConceptDraw Solution Park.
www.conceptdraw.com/ solution-park/ computer-networks-cisco
Router
Broadband router

Router firewall

Wireless router

Workgroup switch
ATM switch
ISDN switch
Multilayer switch
Protocol translator
Communications server

Transpath
Bridge

Terminal server

Route switch processor
Content engine (cache director)
-cisco-network-topology---vector-stencils-library.png--diagram-flowchart-example.png)
Management engine (ME 1100)
-cisco-network-topology---vector-stencils-library.png--diagram-flowchart-example.png)
Switch processor
ITP
Voice gateway
BBSM
ATA
SIP Proxy server
NetRanger
Cisco 1000
IP
System controller
ACE

Directory server

ADM
Cisco Unity Express
Unity server
Cisco security
CallManager
DSLAM
H.323
CDM (Content Distribution Manager)
-cisco-network-topology---vector-stencils-library.png--diagram-flowchart-example.png)
ICM
Access point
Wireless bridge

Wireless connectivity

Guard
Mobile access router
Carrier Routing System (CRS)
-cisco-network-topology---vector-stencils-library.png--diagram-flowchart-example.png)
Vault
Workstation
PC
Macintosh
Cloud, gold
Cloud, white

Cloud, standard color

Cisco security management
PBX
DPT
Government building

Headquarters, blue
Router in building
Man
Woman
Workgroup switch, subdued
Router, subdued
File server
Firewall, horizontal

Firewall, vertical

Firewall, vertical, subdued

Lock

Key

Lock and key

Car
Truck
File cabinet

Breakout box
Breakout box, blue

Host

Relational database
Modem
BBS (Bulletin Board System)
-cisco-network-topology---vector-stencils-library.png--diagram-flowchart-example.png)
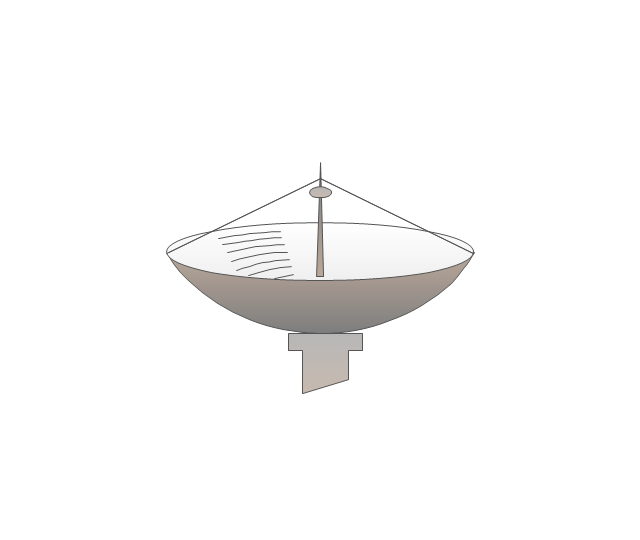
Satellite
Satellite dish
UPS

RPS

MAU
PAD

PAD X.28

Diskette
Contact center
Page icon
Antenna
Antenna, blue

Radio tower

The vector stencils library "Cisco products additional" contains 141 symbols of computer network devices and equipment for drawing Cisco network diagrams.
The symbols example "Cisco products additional - Vector stencils library" was created using the ConceptDraw PRO diagramming and vector drawing software extended with the Cisco Network Diagrams solution from the Computer and Networks area of ConceptDraw Solution Park.
www.conceptdraw.com/ solution-park/ computer-networks-cisco
Protocol translator
CiscoWorks workstation
Access server

Workgroup director
Network management appliance
Storage Solution Engine (SSE)
-cisco-products-additional---vector-stencils-library.png--diagram-flowchart-example.png)
Software based router on file / application server
Cisco MeetingPlace Express
PC router card
Transpath
Bridge

IOS SLB
100BaseT hub
uBR910
CDDI-FDDI
PC adapter card
VIP
CSM-S
Terminal server

Route/Switch processor with Si
Route/Switch processor
PXF
AVS (Application Velicity System)
-cisco-products-additional---vector-stencils-library.png--diagram-flowchart-example.png)
Content engine (cache director)
-cisco-products-additional---vector-stencils-library.png--diagram-flowchart-example.png)
Cisco file engine
Management engine (ME 1100)
-cisco-products-additional---vector-stencils-library.png--diagram-flowchart-example.png)
PC with router-based software
PC with software
ASIC processor
Generic processor
Switch processor
Cisco 5500 family
Multi-switch device
IP transport concentrator
ITP
Cisco CA
Voice gateway
BBSM
ATA
SIP Proxy server

MicroWeb server

NetRanger
Cisco 6920 RateMux
NetSonar
Cisco 1000
IP
System controller
ACE
Voice-enabled access server (voice-enabled communications server)
-cisco-products-additional---vector-stencils-library.png--diagram-flowchart-example.png)
Directory server

Cisco 4310 end office system
ADM
FireWall Service Module (FWSM)
-cisco-products-additional---vector-stencils-library.png--diagram-flowchart-example.png)
Cisco Unity Express
Cisco Unity Server
Centri firewall
Cisco Security Manager

Data switch processor (AKA data center switch)
-cisco-products-additional---vector-stencils-library.png--diagram-flowchart-example.png)
Cisco MP
IOS firewall
PIX firewall, right

PIX firewall, left
CallManager
Cisco 6700 Series
MGX 8240
MGX 8220
MGX 8260
DSLAM
Cisco 6732 access server
Cisco 6701
H.323
Access gateway

ICS 7750
VPN concentrator
SSL terminator
CDM (Content Distribution Manager)
-cisco-products-additional---vector-stencils-library.png--diagram-flowchart-example.png)
Cisco 15200
Cisco 15800
Content Service Module
Content Transformation Engine (CTE)
-cisco-products-additional---vector-stencils-library.png--diagram-flowchart-example.png)
Cisco VN 2900
Cisco VN 5900
Cisco VN 5902
Cisco Unified Presence Server
ICM
PC card
Access point
Dual mode access point
EtherClient

Tablet
Wireless transport
Wireless bridge

Lightweight single radio access point
Lightweight Double Radio Access Point
WLAN controller
Wi-Fi tag
Wireless location appliance
Wireless connectivity

WiSM
Mesh AP
SC2200 Signaling Controller
Virtual Switch Controller (VSC3000)
-cisco-products-additional---vector-stencils-library.png--diagram-flowchart-example.png)
VS C3000 or SC2200 host
BTS 10200 Softswitch
Detector
IP/TV content manager
IP/TV broadcast server
Universal gateway

Generic softswitch
Generic Softswitch (blue)
-cisco-products-additional---vector-stencils-library.png--diagram-flowchart-example.png)
Guard
Mobile access router
Carrier Routing System (CRS)
-cisco-products-additional---vector-stencils-library.png--diagram-flowchart-example.png)
FC storage
Intelliswitch Stack

Service control
UPC (Unified Personal Communicator)
-cisco-products-additional---vector-stencils-library.png--diagram-flowchart-example.png)
PMC
IP communicator
Streamer
Vault
DWDM filter
DWDM ring
DWDM network line
Streamer (half-full)
-cisco-products-additional---vector-stencils-library.png--diagram-flowchart-example.png)
Vault (half-full)
-cisco-products-additional---vector-stencils-library.png--diagram-flowchart-example.png)
Data center switch, reversed
Scanner
10GE/FCoE
car
CUBE
Director-class fibre channel director
Fibre channel disk subsystem
Fibre channel fabric switch
Generic gateway

Handheld
Internet streamer

JBOD

MAS gateway
Mesh AP
Mobile streamer
This example of a Top Level Context Diagram for an information system management process was redesigned from the Wikipedia file: IDEF Top-Level Context Diagram.jpg. [en.wikipedia.org/ wiki/ File:IDEF_ Top-Level_ Context_ Diagram.jpg]
"Graphical notation.
IDEF0 is a model that consists of a hierarchical series of diagrams, text, and glossary cross referenced to each other. The two primary modeling components are:
(1) functions (represented on a diagram by boxes), and
(2) data and objects that interrelate those functions (represented by arrows).
... the position at which the arrow attaches to a box conveys the specific role of the interface. The controls enter the top of the box. The inputs, the data or objects acted upon by the operation, enter the box from the left. The outputs of the operation leave the right-hand side of the box. Mechanism arrows that provide supporting means for performing the function join (point up to) the bottom of the box.
The IDEF0 process.
The IDEF0 process starts with the identification of the prime function to be decomposed. This function is identified on a “Top Level Context Diagram,” that defines the scope of the particular IDEF0 analysis. ... From this diagram lower-level diagrams are generated." [IDEF0. Wikipedia]
The IDEF0 diagram example "Top-level context diagram" was created using the ConceptDraw PRO diagramming and vector drawing software extended with the IDEF0 Diagrams solution from the Software Development area of ConceptDraw Solution Park.
IDEF0 diagram

- Hotel reservation system | Sales Flowcharts | Total Quality ...
- Data Flow Diagram Examples
- Hotel reservation system | Sales Process Management | Structured ...
- Context Diagram For Hotel Reservation System
- Context Diagram Online Hotel And Resort Reservation System
- Process Flowchart | Hotel reservation system | Flowchart For Airline ...
- Hotel reservation system | Basic Flowchart Symbols and Meaning ...
- Hotel reservation system | Data Flow Diagrams (DFD) | Basic ...
- Taxi service - Workflow diagram | Hotel reservation system ...
- Hotel reservation system | Network Diagramming Software for ...
- Hotel reservation system | Sales Process Management | Flyer ...
- Process Flowchart | Accounting Flowchart Symbols | Hotel ...
- Hotel reservation system | Audit Flowcharts | Cross-Functional ...
- Examples Of Dfd Of Hotel Reservation
- Process Flowchart | Hotel reservation system | Business Process ...
- Process Flowchart | Floor Plans | Hotel reservation system ...
- Hotel Reservation System Project Using Dfd Erd And Use Case
- Sales Flowcharts | Data Flow Diagram Of Hotel Reservation System ...
- Pert Chart For Hotel Reservation System
- Business Process Diagrams | Hotel reservation system | Workflow ...