Pyramid Diagram

Decision Making Software For Small Business


Types of Flowcharts


Accounting Flowchart

Bubble Chart
Account Flowchart. Flowchart Examples

Create Response Charts

Pyramid Diagram and Pyramid Chart

Pyramid Diagram

Helpful in all stages of quality management

Introduction to bookkeeping: Accounting flowchart process

Flow Chart Online

Pyramid Diagram

Education Information

Pyramid Diagram

A five level pyramid model of different types of Information Systems based on the information processing requirement of different levels in the organization. The first level represents transaction processing systems to process basic data. The second level represents office support systems to process information in office. The third level represents management information systems to process information by managers. The fourth level represents decision support systems to process explicit knowledge. The fifth level represents executive information systems to process tacit knowledge.
"A Computer(-Based) Information System is essentially an IS using computer technology to carry out some or all of its planned tasks. The basic components of computer based information system are:
(1) Hardware - these are the devices like the monitor, processor, printer and keyboard, all of which work together to accept, process, show data and information.
(2) Software - are the programs that allow the hardware to process the data.
(3) Databases - are the gathering of associated files or tables containing related data.
(4) Networks - are a connecting system that allows diverse computers to distribute resources.
(5) Procedures - are the commands for combining the components above to process information and produce the preferred output.
The first four components (hardware, software, database and network) make up what is known as the information technology platform. Information technology workers could then use these components to create information systems that watch over safety measures, risk and the management of data. These actions are known as information technology services." [Information systems. Wikipedia]
This pyramid diagram was redesigned using the ConceptDraw PRO diagramming and vector drawing software from Wikimedia Commons file Five-Level-Pyramid-model.png. [commons.wikimedia.org/ wiki/ File:Five-Level-Pyramid-model.png]
This file is licensed under the Creative Commons Attribution 3.0 Unported license. [creativecommons.org/ licenses/ by/ 3.0/ deed.en]
The triangle chart example "Information systems types" is included in the Pyramid Diagrams solution from the Marketing area of ConceptDraw Solution Park.
Pyramid diagram

Diagrams Mean Nothing

A four level pyramid model of different types of Information Systems based on the different levels of hierarchy in an organization. The first level represents transaction processing systems for workers. The second level represents management information systems for middle managers. The third level represents decision support systems for senior menegers. The fourth level represents executive information systems for executives.
"The "classic" view of Information systems found in the textbooks in the 1980s was of a pyramid of systems that reflected the hierarchy of the organization, usually transaction processing systems at the bottom of the pyramid, followed by management information systems, decision support systems, and ending with executive information systems at the top. Although the pyramid model remains useful, since it was first formulated a number of new technologies have been developed and new categories of information systems have emerged, some of which no longer fit easily into the original pyramid model.
Some examples of such systems are:
data warehouses,
enterprise resource planning,
enterprise systems,
expert systems,
search engines,
geographic information system,
global information system,
office automation." [Information systems. Wikipedia]
This diagram was redesigned using the ConceptDraw PRO diagramming and vector drawing software from Wikimedia Commons file Four-Level-Pyramid-model.png. [commons.wikimedia.org/ wiki/ File:Four-Level-Pyramid-model.png]
This file is licensed under the Creative Commons Attribution-Share Alike 3.0 Unported license. [creativecommons.org/ licenses/ by-sa/ 3.0/ deed.en]
The triangle chart example "Information systems types" is included in the Pyramid Diagrams solution from the Marketing area of ConceptDraw Solution Park.
Pyramid diagram

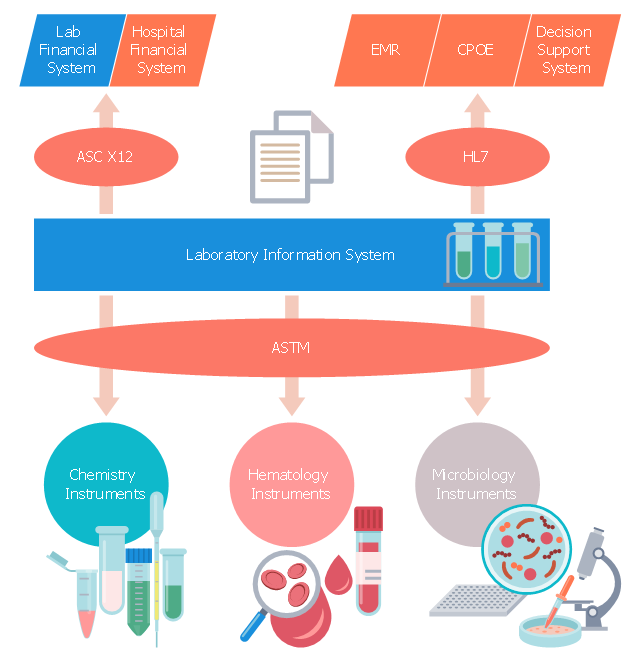
This medical flow chart sample shows logical connections to/ from laboratory information system (LIS) within the hospital.
It was drawn on the base of Wikimedia Commons file: WithinHospital.jpg. [commons.wikimedia.org/ wiki/ File:WithinHospital.jpg]
This file is licensed under the Creative Commons Attribution-Share Alike 3.0 Unported license. [creativecommons.org/ licenses/ by-sa/ 3.0/ deed.en]
"A laboratory information management system (LIMS), sometimes referred to as a laboratory information system (LIS) or laboratory management system (LMS), is a software-based laboratory and information management system with features that support a modern laboratory's operations. Key features include — but are not limited to — workflow and data tracking support, flexible architecture, and data exchange interfaces, which fully "support its use in regulated environments". The features and uses of a LIMS have evolved over the years from simple sample tracking to an enterprise resource planning tool that manages multiple aspects of laboratory informatics." [Laboratory information management system. Wikipedia]
The medical flowchart example "Laboratory Information System within the hospital" was designed using ConceptDraw PRO software extended with Healthcare Workflow Diagrams solution from Business Processes area of ConceptDraw Solution Park.
Medical flowchart
- Mis Flow Chart In Decision Making
- With Aid Of Diagram Illustrate The Stages Of Decision Making In Mis
- How to Draw Business Process Diagrams with RapidDraw Interface ...
- Flow Chart Of Decision Process In Mis
- What Is Flowchart Of Decision Process In Mis
- 4 Level pyramid model diagram - Information systems types | 5 Level ...
- Block diagram - Customer decision making | How to Draw Business ...
- Basic Flowchart Symbols and Meaning | Cross-Functional Flowchart ...
- Chart Of Management Information System With Diagram
- How to Create Flowcharts for an Accounting Information System ...
- Process Flowchart | Decision Making Software For Small Business ...
- Process Flowchart | Data Flow Diagram | Entity-Relationship ...
- Block Diagrams | Marketing Diagrams | Digrams Of Decision Making
- Decision Making | Pyramid Diagram | Workflow Diagram | Decision ...
- Value Stream Mapping | Flow Chart In Mis
- 5 Level pyramid model diagram - Information systems types | 4 Level ...
- Process Flowchart | Value Stream Mapping | Entity-Relationship ...
- Pyramid Diagram | Decision Making | Quality Management System ...
- Pyramid Diagrams | Explain In Detail Organizational Pyramid And ...
- Define General System Flow Chart In Mis