Process Flowchart


Basic Flowchart Symbols and Meaning


Flow chart Example. Warehouse Flowchart


IDEF3 Standard

 ConceptDraw Solution Park
ConceptDraw Solution Park collects graphic extensions, examples and learning materials
IDEF9 Standard

IDEF1 standard

Interior Design Storage and Distribution - Design Elements

Bar Diagrams for Problem Solving. Create manufacturing and economics bar charts with Bar Graphs Solution

Swim Lane Diagrams

Building Drawing Software for Design Office Layout Plan


This cause and effect diagram sample was redesigned from the Wikimedia Commons file: Ursache Wirkung Diagramm Beispiel.png. [commons.wikimedia.org/ wiki/ File:Ursache_ Wirkung_ Diagramm_ Beispiel.png]
This file is licensed under the Creative Commons Attribution-Share Alike 3.0 Unported license. [creativecommons.org/ licenses/ by-sa/ 3.0/ deed.en]
"Productivity is the ratio of output to inputs in production; it is an average measure of the efficiency of production. Efficiency of production means production’s capability to create incomes which is measured by the formula real output value minus real input value.
Productivity is a crucial factor in production performance of firms and nations. Increasing national productivity can raise living standards because more real income improves people's ability to purchase goods and services, enjoy leisure, improve housing and education and contribute to social and environmental programs. Productivity growth also helps businesses to be more profitable." [Productivity. Wikipedia]
The fishbone diagram example "Increase in productivity" was created using the ConceptDraw PRO diagramming and vector drawing software extended with the Fishbone Diagrams solution from the Management area of ConceptDraw Solution Park.
Ishikawa diagram

Total Quality Management with ConceptDraw
 method - Fishbone diagram template")
 Entity-Relationship Diagram (ERD)
Entity-Relationship Diagram (ERD) solution extends ConceptDraw PRO software with templates, samples and libraries of vector stencils from drawing the ER-diagrams by Chen's and crow’s foot notations.
Quality Management System

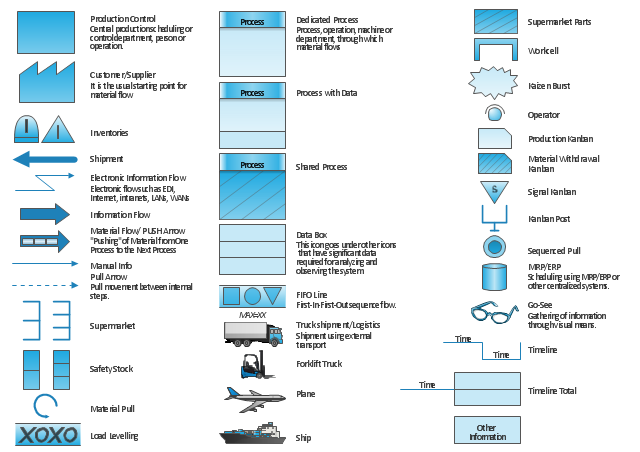
"Value stream mapping usually employs standard symbols to represent items and processes, therefore knowledge of these symbols is essential to correctly interpret the production system problems." [Value stream mapping. Wikipedia]
The vector stencils library Value stream mapping contains 43 symbols for drawing the value stream mapping diagrams using the ConceptDraw PRO diagramming and vector drawing software.
The example "Design elements - Value stream mapping diagram" is included in the Value Stream Mapping solution from the Quality area of ConceptDraw Solution Park.
VSM symbols
Data modeling with ConceptDraw PRO

Control and Information Architecture Diagrams (CIAD) with ConceptDraw PRO

- Swim Lane Diagrams | Cross-Functional Flowchart (Swim Lanes ...
- Fishbone diagram - Production process | Total Quality Management ...
- Data Flow Diagram Model | DFD - Model of small traditional ...
- Types of Flowchart - Overview | Process Flowchart | Business ...
- Fishbone Diagram | Types of Flowchart - Overview | Swim Lane ...
- Basic Flowchart Symbols and Meaning | Flowchart design ...
- Engineering | Process Flowchart | Total Quality Management TQM ...
- Organigrams with ConceptDraw PRO | Design elements ...
- Data Flow Diagram Model
- Fishbone Diagram | Fishbone diagram - Production process | Total ...
- Types of Flowchart - Overview | Process Flowchart | Swim Lane ...
- Engineering | Process Flowchart | IDEF0 standard with ...
- Process Flowchart | Work Flow Diagrams with ConceptDraw PRO ...
- IDEF0 standard with ConceptDraw PRO | IDEF0 Diagrams | How to ...
- Block Diagrams | IDEF0 standard with ConceptDraw PRO | IDEF3 ...
- IDEF0 standard with ConceptDraw PRO | IDEF0 Diagrams | IDEF0 ...
- Data Flow Diagrams | Process Flowchart | Universal Diagramming ...
- Best Vector Drawing Application for Mac OS X | Create Block ...
- Draw Block Diagram Communication System Osx
- Block Diagrams | IDEF0 standard with ConceptDraw PRO | ER ...