HelpDesk
How to Manage Problem Solving Using Seven Management and Planning Tools


CORRECTIVE ACTIONS PLANNING. Risk Diagram (PDPC)
 - Health care")
"Chronic care management encompasses the oversight and education activities conducted by health care professionals to help patients with chronic diseases and health conditions such as diabetes, high blood pressure, lupus, multiple sclerosis and sleep apnea learn to understand their condition and live successfully with it. This term is equivalent to disease management (health) for chronic conditions. The work involves motivating patients to persist in necessary therapies and interventions and helping them to achieve an ongoing, reasonable quality of life." [Chronic care management. Wikipedia]
The health care risk diagram (process decision program chart, PDPC) example "Chronic care improvement" was created using the ConceptDraw PRO diagramming and vector drawing software extended with the solution "Seven Management and Planning Tools" from the Management area of ConceptDraw Solution Park.
The health care risk diagram (process decision program chart, PDPC) example "Chronic care improvement" was created using the ConceptDraw PRO diagramming and vector drawing software extended with the solution "Seven Management and Planning Tools" from the Management area of ConceptDraw Solution Park.
Risk diagram
.png--diagram-flowchart-example.png)
HelpDesk
How To Create Risk Diagram (PDPC)
 sample")
The Best Flowchart Software Available

ConceptDraw PRO vector diagramming and business graphics software enhanced with with templates, samples and stencil libraries from ConceptDraw Solution Park helps you to easily draw flowcharts, block diagrams, bar charts, histograms, pie charts, divided bar diagrams, line graphs, area charts, scatter plots, circular arrows diagrams, Venn diagrams, bubble diagrams, concept maps, and others.

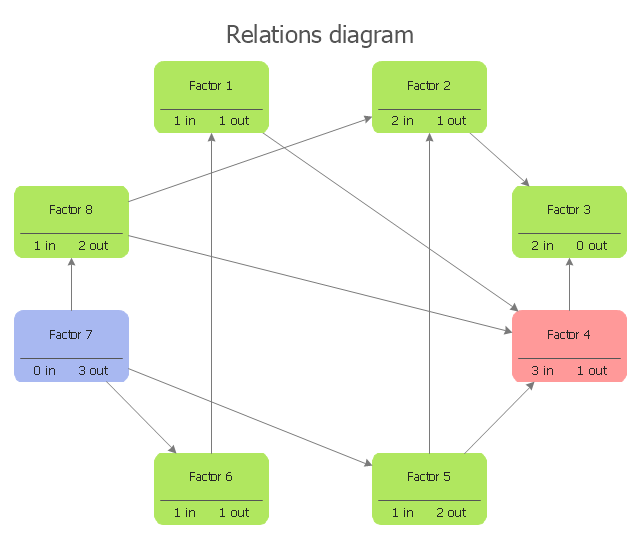
"Interrelationship digraph is a method to identify relationships among a set of items. Items that have a cause or effect associated on another item are linked together (and given weight) for the purpose of identifying the items most affected or items affecting other items the most, giving emphasis on those items for risk mitigation planning. Items involved in risk management could be risks being mitigated, risk strategies, project activities or resources. ...
This method fosters broad thinking of individuals to identify interrelationships of risk items that affect the whole project, determining critical risk areas that must be dealt first and ensures efficient allocation of project resources." [sce.uhcl.edu/ helm/ Risk_ Man_ WEB/ Planning%20 Worksheet%20 Notes_ files%5Cintrldgm.htm]
Relation diagram (interrelationship digraph, relationships digram) helps identify what factors are causes and which factors are effects. Factors help establish KPI (Key Performance Indicators) to monitor changes and the effectiveness of corrective actions in resolving a problem.
The relations diagram is one of the Seven Management and Planning Tools (7 MP tools, Seven New Quality Tools).
The relations diagram template for the ConceptDraw PRO diagramming and vector drawing software is included in the solution "Seven Management and Planning Tools" from the Management area of ConceptDraw Solution Park.
Interrelationship digraph template
"Process Decision Program Chart (PDPC).
A useful way of planning is to break down tasks into a hierarchy, using a tree diagram. The PDPC extends the tree diagram a couple of levels to identify risks and countermeasures for the bottom level tasks. Different shaped boxes are used to highlight risks and identify possible countermeasures (often shown as 'clouds' to indicate their uncertain nature). The PDPC is similar to the Failure Modes and Effects Analysis (FMEA) in that both identify risks, consequences of failure, and contingency actions; the FMEA also rates relative risk levels for each potential failure point." [Seven Management and Planning Tools. Wikipedia]
The Risk diagram (process decision program chart, PDPC) determines the risks when corrective action is not performed correctly. Also, it helps develop descriptions for preventive actions at the level of execution.
The Risk diagram (PDPC) template for the ConceptDraw PRO diagramming and vector drawing software is included in the solution "Seven Management and Planning Tools" from the Management area of ConceptDraw Solution Park.
Risk diagram
---template.png--diagram-flowchart-example.png)
PDPC

PROBLEM ANALYSIS. Root Cause Analysis Tree Diagram

ConceptDraw Office suite is a software for problem analysis.
The Action Plan

ConceptDraw Office suite is a software for decision making and action plan.
Affinity Diagram

 ConceptDraw Solution Park
ConceptDraw Solution Park collects graphic extensions, examples and learning materials
Activity Network Diagram Method

This sample shows the PERT (Program Evaluation Review Technique) chart of the request on proposal. A request for proposal (RFP) is a request of the company or the organization to potential suppliers to submit the business proposals for service or goods that it is interested to purchase. The RFP is represented on the initial procurement stage and allows to define the risks and benefits.
PROBLEM ANALYSIS. Prioritization Matrix

Preventive Action
 - Minimization-of-material-wastage")
Skilled use of these diagrams makes collaborative teamwork both more engaging and more effective.
Decision Making

The Seven Management and Planning Tools is a set for such diagrams: Affinity Diagram, Relations Diagram, Prioritization Matrix, Root Cause Tree Diagram, Involvement Matrix, PERT Chart, Risk Diagram (PDPC).
PROBLEM ANALYSIS. Identify and Structure Factors

ConceptDraw Office suite is a software for identify and structure factors with affinity diagram. This is a grouping and structuring of factors that impact on a problem.
CORRECTIVE ACTIONS PLANNING. PERT Chart

ConceptDraw Office suite is a software for corrective actions planning.
Cause and Effect Analysis

- Risk management - Concept map | The Best Flowchart Software ...
- Using Fishbone Diagrams for Problem Solving | Concept map - Risk ...
- Seven Management and Planning Tools | CORRECTIVE ACTIONS ...
- Cause and Effect Analysis (Fishbone Diagrams ) | How To Create ...
- CORRECTIVE ACTIONS PLANNING. Risk Diagram (PDPC) | How ...
- CORRECTIVE ACTIONS PLANNING. Risk Diagram (PDPC) | How ...
- PROBLEM ANALYSIS. Root Cause Analysis Tree Diagram | Entity ...
- Risk diagram - Chronic Illness Management Program (CIMP ...
- Risk management - Concept map | How To Make a Concept Map ...
- Management | Concept map - Risk management | Seven ...
- Concept map - Risk management | Concept Maps | The Best ...
- Seven Management and Planning Tools | How to Manage Problem ...
- Root cause analysis tree diagram - Template | Fault Tree Diagram ...
- Affinity diagram - Implementing continuous process improvement ...
- Process decision program chart (PDPC) - Personal activity | Process ...
- CORRECTIVE ACTIONS PLANNING Risk Diagram (PDPC) | Risk ...
- Risk management - Concept map
- Process decision program chart (PDPC) - Personal activity | Risk ...
- Event-driven Process Chain Diagrams EPC | Block diagram ...
- Risk management - Concept map | Concept Maps | How To Make a ...