UML Class Diagram Example for Transport System

UML Class Diagram Example for GoodsTransportation System

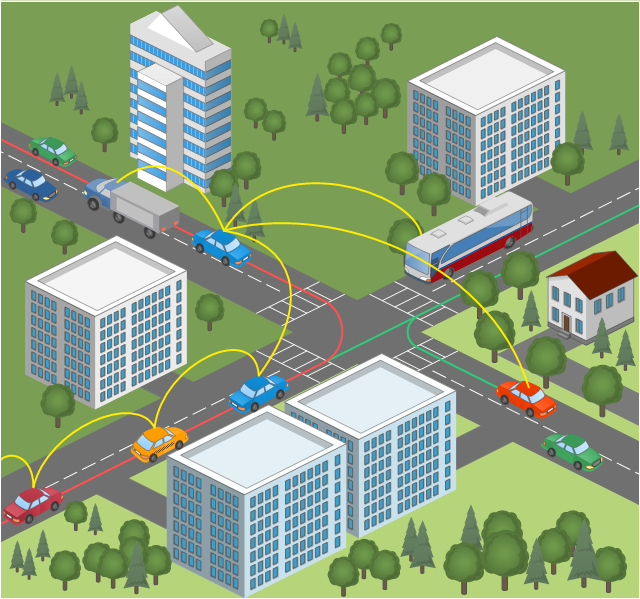
This vehicular network diagram sample was drawn on the base of picture illustrating the post "Intelligent transportation system" from the blog "Technology New Here".
"Intelligent transportation systems are projects that aim to integrate modern communication and information technology into existing transportation management systems in order to optimize vehicle life, fuel efficiency, safety, and traffic in urbanized cities.
The need for intelligent transportation systems stems from the fact that traffic congestion has been increasing all around the world because of increasing population, increasing amount of transportation vehicles and increasing urbanization."
[technologynewhere.wordpress.com/ 2010/ 05/ 12/ intelligent-transportation-system/ ]
The vehicular network diagram example "Intelligent transportation system" was created using the ConceptDraw PRO diagramming and vector drawing software extended with the Vehicular Networking solution from the Computer and Networks area of ConceptDraw Solution Park.
Vehicular network diagram
UML Class Diagram Generalization Example UML Diagrams

UML Class Diagram Example - Apartment Plan

Timing diagram


 Data Flow Diagrams (DFD)
Data Flow Diagrams solution extends ConceptDraw PRO software with templates, samples and libraries of vector stencils for drawing the data flow diagrams (DFD).
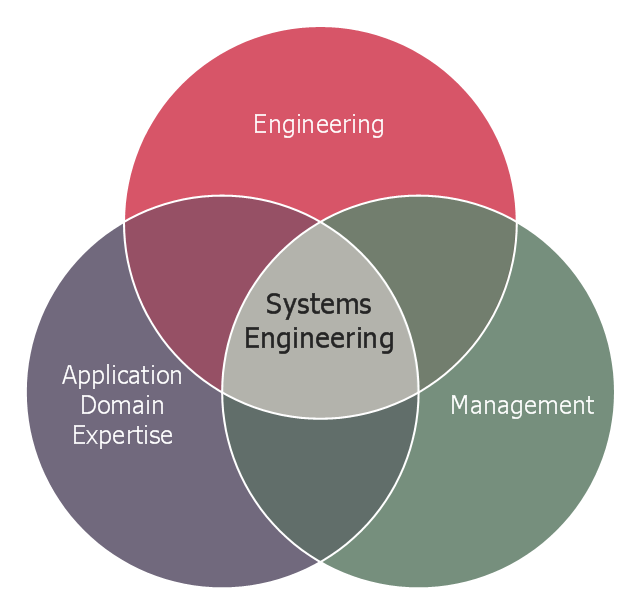
This Venn diagram sample shows the system engineering at the intersection of enginnering, management, and application domain expertise. It was designed on the base of the Venn diagram on the webpage "Intelligent Transportation Systems (ITS) ePrimer, Module 2: Systems Engineering" from the website of the Office of the Assistant Secretary for Research and Technology (OST-R), the U.S. Department of Transportation (US DOT).
"The term interdisciplinary is a fundamental concept in systems engineering. To successfully develop a system requires the application of basic engineering discipline, management discipline, and expertise in the application domain of the system. In the case of ITS, that application domain is transportation engineering. The intersection of these disciplines is the realm of systems engineering."
[pcb.its.dot.gov/ eprimer/ module2.aspx]
The Venn diagram example "Systems engineering improvement" was created using the ConceptDraw PRO diagramming and vector drawing software extended with the Venn Diagrams solution from the area "What is a Diagram" of ConceptDraw Solution Park.
Venn diagram
 Fishbone Diagram
Fishbone Diagrams solution extends ConceptDraw PRO software with templates, samples and library of vector stencils for drawing the Ishikawa diagrams for cause and effect analysis.
 Entity-Relationship Diagram (ERD)
An Entity-Relationship Diagram (ERD) is a visual presentation of entities and relationships. That type of diagrams is often used in the semi-structured or unstructured data in databases and information systems. At first glance ERD is similar to a flowch
"Classic TQM Tools ...
Flow Charts Pictures, symbols or text coupled with lines, arrows on lines show direction of flow. Flowcharting enables
modeling of processes; problems/ opportunities and decision points etc. It develops a common understanding of a process by those in
volved." [whaqualitycenter.org/ Portals/ 0/ Tools%20 to%20 Use/ Classic%20 Quality%20 Tools/ Classic%20 TQM%20 Tools%20 R%20 2-12.pdf]
The vector stencils library TQM diagrams contains 58 symbols for drawing total quality management (TQM) flow charts using the ConceptDraw PRO diagramming and vector drawing software.
The example "Design elements - TQM diagram" is included in the Total Quality Management (TQM) Diagrams solution from the Quality area of ConceptDraw Solution Park.
TQM flow chart symbols

Design Pictorial Infographics. Design Infographics

How to draw Metro Map style infographics? Moscow, New York, Los Angeles, London

 Vehicular Networking
Network engineering is an extensive area with wide range of applications. Depending to the field of application, network engineers design and realize small networks or complex networks, which cover wide territories. In latter case will be ideal recourse to specialized drawing software, such as ConceptDraw PRO.
 Entity-Relationship Diagram (ERD)
Entity-Relationship Diagram (ERD) solution extends ConceptDraw PRO software with templates, samples and libraries of vector stencils from drawing the ER-diagrams by Chen's and crow’s foot notations.
- How Can We Draw Of Deployment Diagram For Transport System
- UML Class Diagram Example for Transport System
- Class Diagram Of Transport Magement System Project In Pdf
- Class Diagram Of Transportation Management System
- UML Class Diagram Example for Transport System | PM Personal ...
- Transportation Infographics | Intelligent transportation system | UML ...
- UML Class Diagram Example for Transport System | Data Flow ...
- Example Of Use Case Diagram In Transportation System
- UML Class Diagram Example for Transport System
- UML Class Diagram Example for Transport System | Rapid UML ...
- Intelligent transportation system | ConceptDraw Solution Park | Fault ...
- UML Class Diagram Example for Transport System | JSD - Jackson ...
- UML Class Diagram Example for GoodsTransportation System ...
- UML Class Diagram Example for Transport System
- Road Transport - Design Elements | UML Class Diagram Example ...
- Erd In Road Transportation System
- UML Class Diagram Example for Transport System | Aerospace and ...
- Intelligent transportation system | Global vehicular network diagram ...
- UML Class Diagram Example for Transport System | Timing diagram ...
- UML Class Diagram Example for Transport System | How to draw ...