Circle Diagrams

What Is a Circle Spoke Diagram

 Circle-Spoke Diagrams
Examples of subject areas that are well suited to this approach are marketing, business, products promotion, process modeling, market, resource, time, and cost analysis. Circle-Spoke Diagrams are successfully used in presentations, conferences, management documents, magazines, reportages, reviews, reports, TV, and social media.
Circle Spoke Diagram Template

3 Circle Venn Diagram. Venn Diagram Example

Best Diagramming


3 Circle Venn. Venn Diagram Example

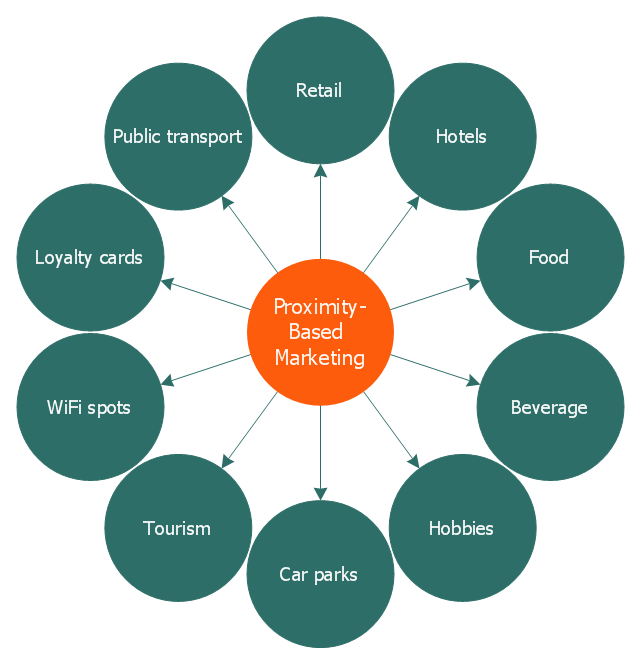
This circle-spoke diagram sample illustrates the proximity marketing.
"Proximity marketing is the localized wireless distribution of advertising content associated with a particular place. Transmissions can be received by individuals in that location who wish to receive them and have the necessary equipment to do so.
Distribution may be via a traditional localized broadcast, or more commonly is specifically targeted to devices known to be in a particular area.
The location of a device may be determined by:
(1) A cellular phone being in a particular cell.
(2) A Bluetooth or WiFi device being within range of a transmitter.
(3) An Internet enabled device with GPS enabling it to request localized content from Internet servers.
(4) A NFC enabled phone can read a RFID chip on a product or media and launch localized content from internet servers.
Communications may be further targeted to specific groups within a given location, for example content in tourist hot spots may only be distributed to devices registered outside the local area.
Communications may be both time and place specific, e.g. content at a conference venue may depend on the event in progress.
Uses of proximity marketing include distribution of media at concerts, information (weblinks on local facilities), gaming and social applications, and advertising." [Proximity marketing. Wikipedia]
The hub-and-spoke diagram example "Proximity based marketing" was created using the ConceptDraw PRO diagramming and vector drawing software extended with the Circle-Spoke Diagrams solution from the area "What is a Diagram" of ConceptDraw Solution Park.
Circle-spoke diagram
UML Diagram for Mac

HelpDesk
How to Draw a Circular Arrows Diagram

UML Notation

 Telecommunication Network Diagrams
Telecommunication Network Diagrams solution extends ConceptDraw DIAGRAM software with samples, templates, and great collection of vector stencils to help the specialists in a field of networks and telecommunications, as well as other users to create Computer systems networking and Telecommunication network diagrams for various fields, to organize the work of call centers, to design the GPRS networks and GPS navigational systems, mobile, satellite and hybrid communication networks, to construct the mobile TV networks and wireless broadband networks.
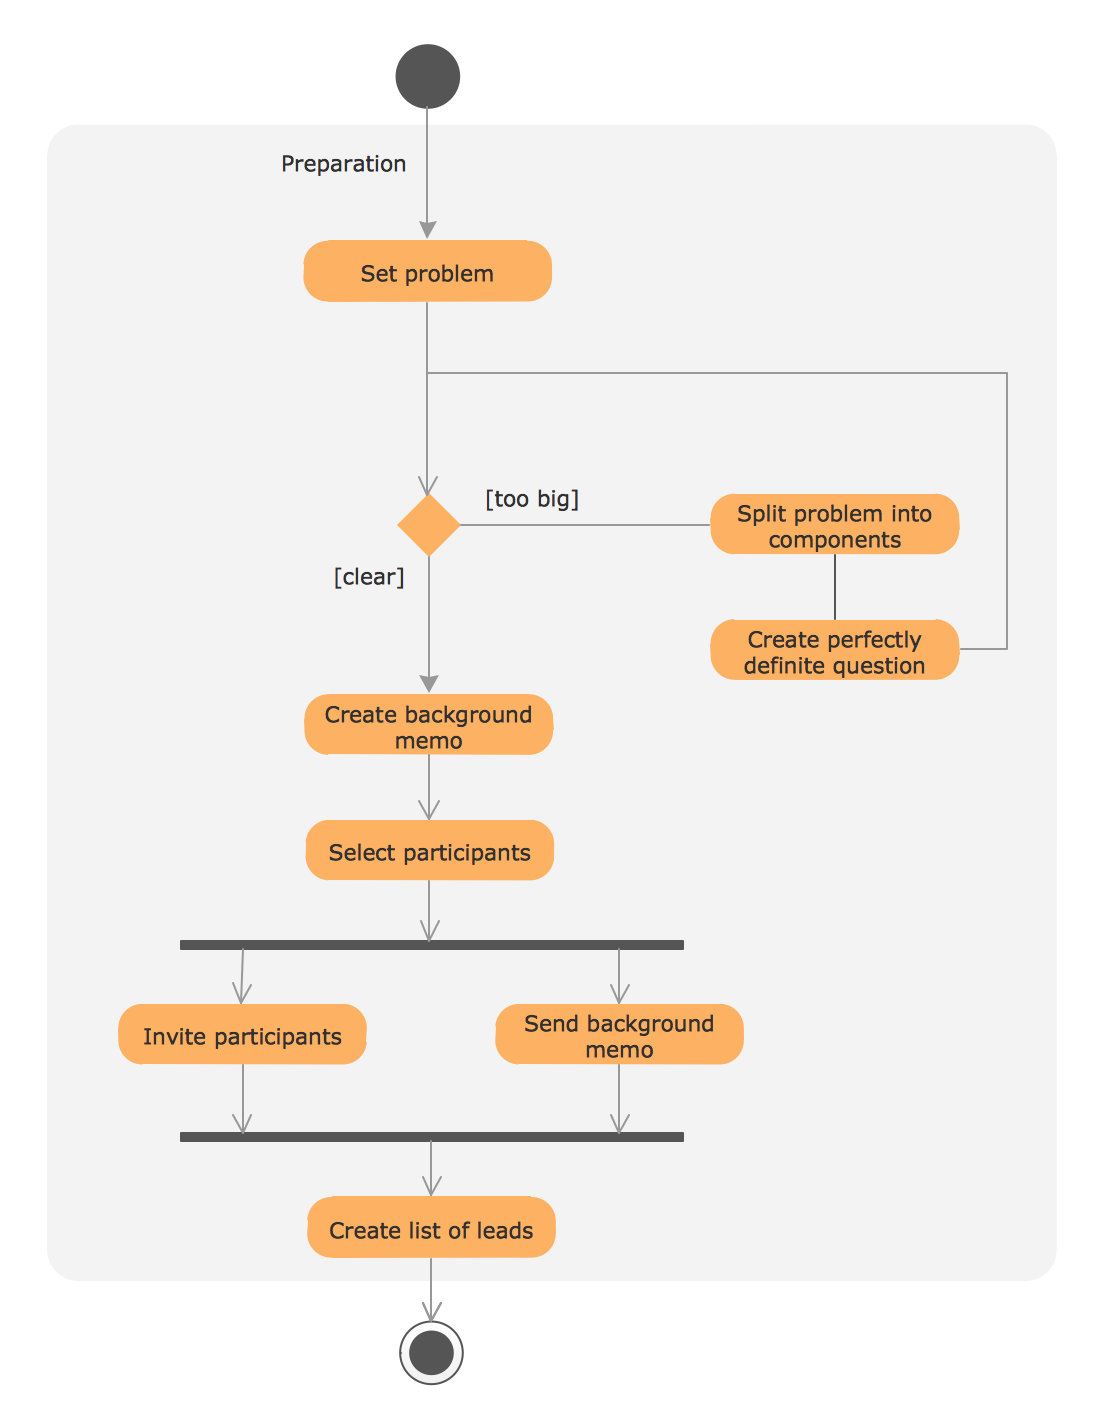
UML Process Diagram Example
 Circular Arrows Diagrams
Circular Arrows Diagrams solution extends ConceptDraw DIAGRAM with extensive drawing tools, predesigned samples, Circular flow diagram template for quick start, and a library of ready circular arrow vector stencils for drawing Circular Arrow Diagrams, Segmented Cycle Diagrams, and Circular Flow Diagrams. The elements in this solution help managers, analysts, business advisers, marketing experts, scientists, lecturers, and other knowledge workers in their daily work.
 Computer Network Diagrams
Computer Network Diagrams solution extends ConceptDraw DIAGRAM software with samples, templates and libraries of vector icons and objects of computer network devices and network components to help you create professional-looking Computer Network Diagrams, to plan simple home networks and complex computer network configurations for large buildings, to represent their schemes in a comprehensible graphical view, to document computer networks configurations, to depict the interactions between network's components, the used protocols and topologies, to represent physical and logical network structures, to compare visually different topologies and to depict their combinations, to represent in details the network structure with help of schemes, to study and analyze the network configurations, to communicate effectively to engineers, stakeholders and end-users, to track network working and troubleshoot, if necessary.
- Communication Circle
- Communication Circle Diagram
- Basic Flowchart Symbols and Meaning | Circle Diagrams | Circle ...
- Marketing Communication Diagram
- What Is a Circle Spoke Diagram
- Best Diagramming | Circle -Spoke Diagrams | Geo Map - Europe ...
- 3 Circle Venn. Venn Diagram Example
- Communication Diagram In Marketing
- Telecommunication Network Diagrams | Aerospace and Transport ...
- UML Diagram for Mac | Communication medium diagram | Metro ...
- Circle Spoke Diagram Template | Circle Diagrams | Program ...
- Communication Cycle Business Basic
- Diagrams Of Marketing Communication Models
- Circle -Spoke Diagrams
- Construction Project Communication Flow Chart
- Research cycle - Circle diagram | Circle Diagrams | Lifecycle of an ...
- Communication Cycle Flow Chart
- Circular Flow Of Communication
- Marketing Communication Process Diagram
- Diagram Of Web Communication Process