This site uses cookies. By continuing to browse the ConceptDraw site you are agreeing to our Use of Site Cookies.

Organization Chart Software: A Comprehensive Guide

Create Organizational Chart Software - You need create Organizational Chart? Nothing could be easier with ConceptDraw DIAGRAM diagramming and vector drawing software. ConceptDraw DIAGRAM presents the Organizational Charts Solution from the Management Area that will allow you to draw the Organization Charts of any difficulty easy and quick.
How to draw an Organizational Chart

organizational chart, org chart Organizational Charts

organizational chart, org chart
Organizational Charts solution extends ConceptDraw DIAGRAM software with samples, templates and library of vector stencils for drawing the org charts.

Examples of Flowcharts, Org Charts and More

ConceptDraw DIAGRAM covers a broad spectrum of business graphics categories and offers at ConceptDraw STORE enormous online collection of pictorial examples and samples for different thematics and application areas. It is a plentiful source of inspiration and wonderful examples of professionally designed diagrams, flowcharts, UML diagrams, organizational charts, databases, ERDs, network diagrams, business charts, different thematic charts, schematics, infographics and plans developed specially for knowledge workers, engineers, managers, businessmen, marketing specialists, analytics, scientists, students, professors, journalists and also for a large number of other people that every day use various diagrams and drawings in their work and life activity. Each of these examples is a real art, all they are well thought-out and designed without efforts with help of powerful tools of ConceptDraw DIAGRAM software. ConceptDraw examples display all variety of tasks, possibilities and results that ConceptDraw Product Line lets achieve fast and easy. ConceptDraw is one of the best Visio alternatives for Mac. It open all Visio formats like.vsdx,.vss,.vdx files and allows you to export files to Visio formats.
What is ConceptDraw OFFICE

Organizational Charts with ConceptDraw DIAGRAM

Organizational chart or Orgchart is a diagram that depicts the structure of an organization using the terms of work responsibility and rank position. It is a useful and convenient format to visually illustrate the relationships within an organization, which is moreover applicable for organization of any size. Typically, an Organizational chart is constructed from the rectangular object blocks, which represent a job title, a person's name and relationships associated with them. You looks for the powerful Orgchart software? ConceptDraw DIAGRAM software is exactly what you've been searching long. Extended with Organizational Charts Solution, ConceptDraw DIAGRAM offers great-looking examples and samples of Orgcharts, built-in templates and various types of predesigned vector block objects and connectors for creation all kinds of Organizational Charts - from simple to complex multi-page. When designing the chart for large organization with complex branched structure, may be convenient to divide it into few smaller charts.

What is an Organizational Chart and how it works?
Organization Chart Software

Organizing process is the process of creating the organizational structure of an enterprise. The organizing process consists of several stages. First, you need to divide the organization into departments, respectively to strategies, and then establish relationships of authority. After that, managing director delegates his rights and authorities.

Organizational Chart Templates

ConceptDraw offers you a number of ready-made organizational chart templates which you can use in your drawing. They are grouped in topical sets as organizational chart template files. Use the Organizational Charts Solution for ConceptDraw DIAGRAM to create your own Organizational Charts of any complexity quick, easy and effective. The Organizational Charts designed with ConceptDraw DIAGRAM are vector graphic documents and are available for reviewing, modifying, converting to a variety of formats (image, HTML, PDF file, MS PowerPoint Presentation, Adobe Flash or MS Visio XML), printing and send via e-mail in one moment.
How to draw an Organizational Chart

Organizational Structure Diagram Software

ConceptDraw DIAGRAM extended with Organizational Charts Solution from the Management Area is a powerful but easy-to-use Organizational Structure Diagram Software. Organizational Charts Solution provides a wide variety of templates and samples and large quantity of predesigned vector objects to help you design your Organizational Structure Diagrams and other business diagrams.
How to draw an Organizational Chart
HelpDesk

How to Draw a Matrix Organizational Chart

There are a number of moments which are influenced on how the organizational structure of a certain business needs to be, how complex, and which type it should keep. The matrix organizational structure is atypical because it brings together employees and managers from different departments to work toward accomplishing a goal. This structure is commonly found in businesses that have more than one line of reportage. For instance, a company might contain an engineering department with engineering managers who workers report to. However, these workers might also have to liaise with different product or project managers depending on current tasks. Some form of matrix organization is found in most large-scale modern businesses. It is one of the most complicated reporting structures. You can easily build a clear matrix organizational chart in ConceptDraw DIAGRAM using templates from ConceptDraw Solution Park.

Stakeholder Onion Diagrams

The Stakeholder Onion Diagram is a popular and widely used way to view the relationships of stakeholders to a project goal. The Onion Diagram focuses on the project goal, most of other diagram styles focus on the project, stakeholders, and timeline. This difference favorably distinguishes and separates the Onion Diagram from other types of diagrams. Design fast and easy Stakeholder Onion Diagrams of any complexity in ConceptDraw DIAGRAM diagramming and vector drawing software using the powerful tools of Stakeholder Onion Diagrams Solution from the Management Area of ConceptDraw Solution Park.

HR Org Structure

ConceptDraw DIAGRAM vector charting software enhanced with HR Flowcharts solution is a suitable tool to create the HR org structure, onboarding model, design HR organizational chart for a company of any size without efforts. Once your HR organizational structure is ready, make the chart accessible to your colleagues. And don't forget that the HR organization chart is an opportunity for growth and should be updated each time when any changes happen in the company. Easily correct your chart in any circumstance: when HR employees change roles, new employees are onboarded, or some employees leave the organization.

Affinity Diagram

The Affinity Diagram, also known as a KJ diagram, is a business tool invented for organization the large quantity of ideas and data. It is a part of Seven Management and Planning Tools, it is usually used right after brainstorming to sort large numbers of ideas into the corresponding groups. The Affinity Diagram helps to represent in a better way the structure of large and complex factors which influence on a problem, divides these factors into the smaller and simpler structures, and helps team members to see the patterns and identify possible solutions to problems they have. The diagrams of this type don't show the causal relationships between the factors, but they are designed to prepare the data for holding further analysis of the cause-effect relationships. Another area of Affinity Diagram usage is contextual inquiry as a way to sort observations and notes from field interviews, support call logs, open-ended survey responses organizing, etc. ConceptDraw MINDMAP software offers you the tools for easy holding brainstorming, generation ideas and creation MINDMAP Affinity Diagram.

Organizational Structure

The organizational structure reflects the composition and hierarchy of company's divisions, determines the distribution of authorities and responsibilities within the organization, and facilitates the understanding by workers their responsibilities. It also defines the group of people making key decisions at the company. Visualization of organizational structure of any company, organization or institution is not an easy task, because sometimes the company may include several departments, each with more than thousand persons. For such large organizations often are created the Organizational charts for every department separately. There are many ways of organization's structuring, which determine its work. Often happens that organizational structure adapts to production process. ConceptDraw DIAGRAM extended with unique Organizational Charts solution from Management area of ConceptDraw Solution Park is a powerful organizational structure software, which ideally suits for developing Organizational Charts of any type and any complexity.

Gantt Chart Diagram

Gantt Chart is a popular type of bar charts and widely used projects planning method. It helps to illustrate the plan for some project, the progress of tasks, the resources planning, the schedule of works and working time. The Gantt Chart contains a set of intervals (bars) located on the time axis and reflects the use of resources by objects. Each bar represents a separate task in the project, its length is a duration of the work. The vertical axis of the graph represents the list of tasks. Besides, the chart can contain additional data, such as the percents of complete, the total tasks, the tasks dependencies, the key points (milestones), etc. The use of Gantt Chart greatly simplifies the project management and enables to visualize in visual and compressed view the most important information of the project, what resources are used for execution the certain tasks and which must to be the speed of their execution. ConceptDraw Office suite applications help to cope perfectly the project management tasks, to construct easily the basic structure of your project and create a Gantt Chart Diagram. PM Easy solution allows you to plan and execute the projects using the mind mapping technique, to implement planning using mind mapping, and track tasks using ConceptDraw Project.

Control and Information Architecture Diagrams (CIAD) with ConceptDraw DIAGRAM

One of the three main constituents of any enterprise is the Control and Information Architecture. The rest two are Production facilities and People and Organization.

Swim Lane Diagrams

Swim Lane Diagrams are the kind of process flow diagrams and effective tool for documenting the business processes required for any business company for its productive work, for easy defining the weak points, reasons of defects, or delays during the process. Swim Lane Diagram is based on the IDEF3 standard and was developed primarily for using in projecting. Its name derives from the use of horizontal or vertical lanes. The blocks that denote the parts of the processes are arranged within definite lanes according to the belonging to responsible worker. So the process of any complexity is visually divided into the parts and represented with indication the responsibility for execution of each part. This significantly facilitates the comprehension of its work. Use the ConceptDraw DIAGRAM software and predesigned vector objects from the Swim Lanes library of Business Process Mapping Solution included to ConceptDraw Solution Park to easy develop Swim Lanes Flowcharts and Diagrams, for modeling and documenting the business processes in a simple and visual graphic form.
"The organization chart is a diagram showing graphically the relation of one official to another, or others, of a company. It is also used to show the relation of one department to another, or others, or of one function of an organization to another, or others. This chart is valuable in that it enables one to visualize a complete organization, by means of the picture it presents.
A company's organizational chart typically illustrates relations between people within an organization. Such relations might include managers to sub-workers, directors to managing directors, chief executive officer to various departments, and so forth. When an organization chart grows too large it can be split into smaller charts for separate departments within the organization." [Organizational chart. Wikipedia]
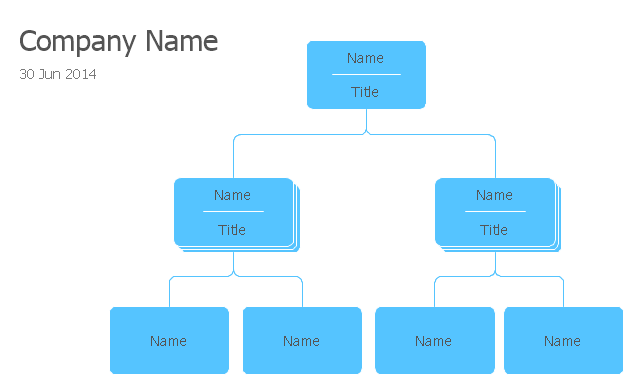
This organizational chart template for the ConceptDraw PRO diagramming and vector drawing software is included in the Organizational Charts solution from the Management area of ConceptDraw Solution Park.
Organizational chart template
Organizational chart template, title, position, manager, executive,

UML Class Diagram Example for GoodsTransportation System

Class Diagram for Goods Transport System in UML. This sample was created in ConceptDraw DIAGRAM diagramming and vector drawing software using the UML Class Diagram library of the Rapid UML Solution from the Software Development area of ConceptDraw Solution Park. This sample shows the concept of working of the transport company and is used by transport companies, carriers at the transportation of various goods.

Organization Chart Templates

Organization Chart Templates - Organizational Charts Solution from the Management Area of ConceptDraw Solution Park provides a wide collection of predesigned templates and samples that will help you create the Organizational Charts of any complexity in one moment.

Matrix Organization

Different organizations have different organizational structures. Matrix organization is one of the most popular and widely used type of organizational structure. Use ConceptDraw DIAGRAM diagramming and vector drawing software extended with 25 Typical Orgcharts solution from the Management area of ConceptDraw Solution Park for fast and easy designing matrix organizational chart for your company.