This site uses cookies. By continuing to browse the ConceptDraw site you are agreeing to our Use of Site Cookies.

How to Create a Social Media DFD Flowchart

Interactive tool helps you create a social media DFD flowchart to find the appropriate response to social media mentions quickly.
It allows companies to be more effective in timely messaging thanks to the ability for rapid response to a customer′s post in social media. This saves budget for companies who use social media for promoting and as a lead generation tool.

Social Media Response Management DFD Charts - software tools

ConceptDraw is your tool for driving social integration and managing change across and streamline social media processes of your organisation.This tool keeps the entire team on the same page allowing you to realize your social media strategy, improve the quality of your answers, and minimize the time it takes to respond.

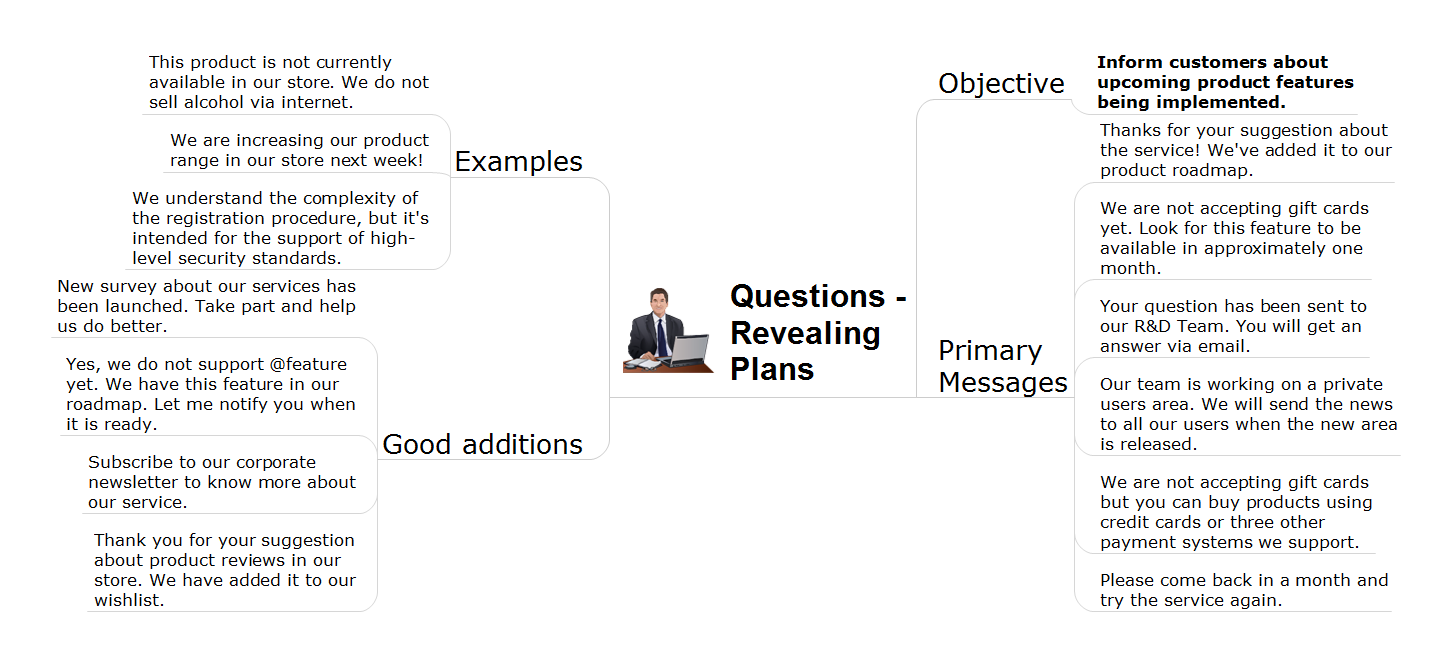
Manage Social Media Response Plan DFD

The Social Media Response solution provides the means to respond to social media mentions quickly and professionally. This tool keeps the entire team on the same page allowing you to realize your social media strategy, improve the quality of your answers, and minimize the time it takes to respond.

Social Media Response DFD Flowcharts - diagramming software ( Mac PC )

Diagramming software for Mac and PC - create flowcharts and presentations for Social Media Organizing.

Building Social Media Response Plan DFD

Using ConceptDraw software is your key to an effective social media marketing plan. Interactive Flowcharts can change the way one creates and organizes their social media response process. Visual navigation through the stages of a response process helps you locate specific actions to be taken via Action Mind Maps.

data flow diagram, DFD templates Data Flow Diagrams (DFD)

data flow diagram, DFD templates
Data Flow Diagrams solution extends ConceptDraw DIAGRAM software with templates, samples and libraries of vector stencils for drawing the data flow diagrams (DFD).
HelpDesk

How to Create a Data Flow Diagram

Data flow diagramming is a highly effective technique for showing the flow of information through a system. Data flow diagrams reveal relationships among and between the various components in a program or system. DFD is an important technique for modeling a system’s high-level detail by showing how input data is transformed to output results through a sequence of functional transformations. The set of standard symbols is used to depict how these components interact in a system. ConceptDraw DIAGRAM allows you to draw a simple and clear Data Flow Diagram using special libraries.

ConceptDraw Solution Park ConceptDraw Solution Park

ConceptDraw Solution Park
ConceptDraw Solution Park collects graphic extensions, examples and learning materials

DFD Flowchart Symbols

A Data Flow Diagram (DFD) is a graphical technique which allows effectively model and analyze the information processes and systems. The ability to fast and easy create the DFDs is made possible with Data Flow Diagrams solution from the Software Development area of ConceptDraw Solution Park. For designing the Data Flow Diagrams are used simple DFD flowchart symbols which are connected each other by arrows depicting the data flow from one step to another.

social media flow chart, social media marketing Social Media Response

social media flow chart, social media marketing
This solution extends ConceptDraw DIAGRAM and ConceptDraw MINDMAP with the ability to draw interactive flow charts with action mind map templates, to help create an effective response to applicable social media mentions.

Social Media Flowchart Symbols

Social media is a popular view of mass communication which allows people, companies and organizations create, share, discover, modify, access, comment, discuss and exchange information through the Internet. Social Media Response solution for ConceptDraw DIAGRAM provides collection of 10 libraries with diversity of predesigned vector social media flowchart symbols for fast and easy creating interactive Social Media Flowcharts, Response Charts and Action Mind Maps.

atm solutions,uml examples, uml example, uml diagram creator, best uml tool, banking system ATM UML Diagrams

atm solutions,uml examples, uml example, uml diagram creator, best uml tool, banking system
The ATM UML Diagrams solution lets you create ATM solutions and UML examples. Use ConceptDraw DIAGRAM as a UML diagram creator to visualize a banking system.
HelpDesk

Accounting Information Systems Flowchart Symbols

An accounting Information system is a combination of software and hardware, as well as organizational support. Information system - it is not only the software and computers with network equipment but also a list of instructions and standards which can be notated using Accounting information systems flowchart symbols. All information systems can be divided into information retrieval and data processing systems. The data Flow model is a hierarchical model. Each process can be divided into structural components, that depict by corresponding flowchart symbols, showing the accounting information system in communication with the external environment. The major components of an accounting information systems flowchart are entities, processes, data stores, and data flows. The set of standard accounting information flowchart symbols is intended to show the relationships between the system components. ConceptDraw DIAGRAM can help to draw clear accounting information system diagrams using special flowchart symbols.