MS Visio Look a Like Diagrams

ConceptDraw DIAGRAM Compatibility with MS Visio

Is ConceptDraw DIAGRAM an Alternative to Microsoft Visio?

Marketing Charts

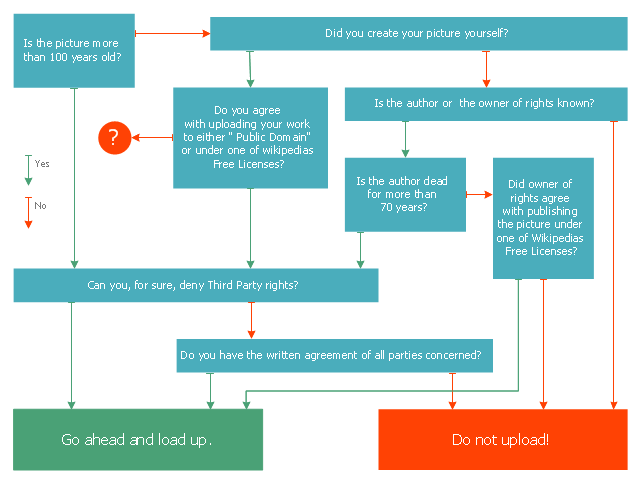
This marketing diagram sample represents decision tree. It was redesigned from the Wikimedia Commons file: Decision Tree on Uploading Imagesv2.svg.
[commons.wikimedia.org/ wiki/ File:Decision_ Tree_ on_ Uploading_ Imagesv2.svg]
"A decision tree is a decision support tool that uses a tree-like graph or model of decisions and their possible consequences, including chance event outcomes, resource costs, and utility. It is one way to display an algorithm.
Decision trees are commonly used in operations research, specifically in decision analysis, to help identify a strategy most likely to reach a goal. ...
A decision tree is a flowchart-like structure in which internal node represents test on an attribute, each branch represents outcome of test and each leaf node represents class label (decision taken after computing all attributes). A path from root to leaf represents classification rules.
In decision analysis a decision tree and the closely related influence diagram is used as a visual and analytical decision support tool, where the expected values (or expected utility) of competing alternatives are calculated.
A decision tree consists of 3 types of nodes:
(1) Decision nodes - commonly represented by squares.
(2) Chance nodes - represented by circles.
(3) End nodes - represented by triangles.
Decision trees are commonly used in operations research, specifically in decision analysis, to help identify a strategy most likely to reach a goal." [Decision tree. Wikipedia]
The marketing diagram example "Decision tree" was created using the ConceptDraw PRO diagramming and vector drawing software extended with the Marketing Diagrams solution from the Marketing area of ConceptDraw Solution Park.
Marketing flowchart
HelpDesk
How to Draw a Decision-Making Diagram

Fault Tree Diagram

 Block Diagrams
Block Diagrams solution with the pre-made templates, samples and stencil libraries full of vector elements can be used for drawing any needed Block diagram, Functional block diagram, or Block flow diagram. Using the created block diagrams for visualizing the high-levelled concepts of engineering, software system design and business, any business owner has a chance to succeed in doing what he is meant to. Many business specialists, business owners, and project managers will find the ConceptDraw DIAGRAM block diagram creator with Block Diagrams solution useful for drawing the 2D and 3D Block diagrams as using the pre-designed objects.
, t chart, decision matrix, decision tree analysis") Decision Making
Decision Making
The Decision Making solution offers the set of professionally developed examples, powerful drawing tools and a wide range of libraries with specific ready-made vector decision icons, decision pictograms, decision flowchart elements, decision tree icons, decision signs arrows, and callouts, allowing the decision maker (even without drawing and design skills) to easily construct Decision diagrams, Business decision maps, Decision flowcharts, Decision trees, Decision matrix, T Chart, Influence diagrams, which are powerful in questions of decision making, holding decision tree analysis and Analytic Hierarchy Process (AHP), visual decomposition the decision problem into hierarchy of easily comprehensible sub-problems and solving them without any efforts.
Influence Diagram

Fault Tree Analysis Example

Fault Tree Analysis Software

Influence Diagram Software

Create Flow Chart on Mac

 Cross-Functional Flowcharts
The Cross-Functional Flowcharts solution extends ConceptDraw DIAGRAM software with cross functional flowchart examples, samples, and libraries of cross functional flow chart vector design elements and CH-1 symbols for easy drawing professional-looking and illustrative Cross Functional Flowchart, Cross Functional Diagram, CH-1 Diagram, Process Flowchart, Deployment Flowchart, Opportunity Flowchart, Swimlane Process Mapping Diagram, or Visio Cross Functional Flowchart for planning and further analyzing, optimizing and improvement processes. The use of included pre-made cross functional flowchart template, opportunity flowchart template, and swimlane process map template, greatly easier designing your Cross-functional flowcharts.
 Funnel Diagrams
Funnel Diagrams solution including wide range of Funnel diagram samples, Sales funnel examples, and vector design elements, makes the ConceptDraw DIAGRAM ideal for managing funnel and creating the Funnel diagrams of various types and designs, AIDA Model, AIDAS, ACCA Dagmar, Rossiter-Percy Model, sales funnel, marketing funnel, search funnel, brand funnel, purchase funnel, lead funnel, conversion funnel, business funnel, etc. You can place the funnel object horizontally or vertically, you can use the objects with the desired number of sales funnel stages. You can also change their size, color fill and other parameters to make the Funnel diagrams look extremely suitable to your desires.
 Customer Journey Mapping
Customer Journey Mapping Solution for ConceptDraw DIAGRAM opens incredibly broad opportunities for marketing and business specialists, product managers, designers, engineers, and other people interested in business development, increasing the product’s audience, its success and users' demand, providing them with capabilities of customer journey mapping. The included diagramming and customer journey mapping tools, predesigned vector customer journey mapping icons and charts, consumer journey mapping connectors, user journey and customer mapping figures, customer experience map icons and touchpoint icons, quick-start templates and samples provide excellent conditions for the customer journey mapping process, for creating Customer Journey Map and Customer Experience Map.
 Jackson Structured Programming (JSP) Diagrams
The Jackson Structured Programming (JSP) Diagram solution extends the functionality and drawing abilities of the ConceptDraw DIAGRAM software with set of illustrative JSP diagrams samples and large variety of predesigned vector objects of actions, processes, procedures, selection, iteration, as well as arrows and connectors to join the objects during Jackson structured development and designing Jackson structured programming diagrams, JSP diagram, Jackson structure diagram (JSD), Program structure diagram. The powerful abilities of this solution make the ConceptDraw DIAGRAM ideal assistant for programmers, software developers, structural programmers, computer engineers, applications constructors, designers, specialists in structured programming and Jackson systems design, and other technical, computer and software specialists.
Tool for Workgroup Briefings, Meetings and Decisions


 Marketing Diagrams
Marketing Diagrams solution extends ConceptDraw DIAGRAM diagramming software with abundance of samples, templates and vector design elements intended for easy graphical visualization and drawing different types of Marketing diagrams and graphs, including Branding Strategies Diagram, Five Forces Model Diagram, Decision Tree Diagram, Puzzle Diagram, Step Diagram, Process Chart, Strategy Map, Funnel Diagram, Value Chain Diagram, Ladder of Customer Loyalty Diagram, Leaky Bucket Diagram, Promotional Mix Diagram, Service-Goods Continuum Diagram, Six Markets Model Diagram, Sources of Customer Satisfaction Diagram, etc. Analyze effectively the marketing activity of your company and apply the optimal marketing methods with ConceptDraw DIAGRAM software.
- Decision tree diagram | Marketing Diagrams | MS Visio Look a Like ...
- ConceptDraw DIAGRAM Compatibility with MS Visio | Decision ...
- Fault Tree Diagram | Marketing Charts | IDEF0 Visio | Decision Tree ...
- Is ConceptDraw DIAGRAM an Alternative to Microsoft Visio ? | Fault ...
- ConceptDraw DIAGRAM Compatibility with MS Visio | Online ...
- MS Visio Look a Like Diagrams | Online Decision Tree Maker
- MS Visio Look a Like Diagrams | Decision Tree Download Free
- Fault Tree Diagram | Decision Tree Visio Template - Conceptdraw.com
- Fault Tree Diagram | Visio Decision Tree Example - Conceptdraw.com