 Telecommunication Network Diagrams
Telecommunication Network Diagrams solution extends ConceptDraw DIAGRAM software with samples, templates, and great collection of vector stencils to help the specialists in a field of networks and telecommunications, as well as other users to create Computer systems networking and Telecommunication network diagrams for various fields, to organize the work of call centers, to design the GPRS networks and GPS navigational systems, mobile, satellite and hybrid communication networks, to construct the mobile TV networks and wireless broadband networks.
 Vehicular Networking
The Vehicular Networking solution extends the ConceptDraw DIAGRAM software functionality with specialized tools, wide variety of pre-made vector objects, collection of samples and templates in order to help network engineers design vehicular network diagrams for effective network engineering activity, visualize vehicular networks, develop smart transportation systems, design various types of vehicle network management diagrams, regional network diagrams, vehicular communication system diagrams, vehicular ad-hoc networks, vehicular delay-tolerant networks, and other network engineering schemes.
Diagramming Software for Design UML Communication Diagrams


Technical Flow Chart

 Computers and Communications
Computers and communications solution extends ConceptDraw DIAGRAM software with illustration samples, templates and vector stencils libraries with clip art of computers, control devices, communications, technology, Apple machines.
 Interactive Voice Response Diagrams
Interactive Voice Response Diagrams solution extends ConceptDraw DIAGRAM software with samples, templates and libraries of ready-to-use vector stencils that help create Interactive Voice Response (IVR) diagrams illustrating in details a work of interactive voice response system, the IVR system’s logical and physical structure, Voice-over-Internet Protocol (VoIP) diagrams, and Action VoIP diagrams with representing voice actions on them, to visualize how the computers interact with callers through voice recognition and dual-tone multi-frequency signaling (DTMF) keypad inputs.
Pyramid Diagram

Diagramming Software for Design UML Collaboration Diagrams

Types of Flowcharts


 Rapid UML
Rapid UML solution extends ConceptDraw DIAGRAM software with templates, samples and libraries of vector stencils for quick drawing the UML diagrams using Rapid Draw technology.
 ATM UML Diagrams
The ATM UML Diagrams solution lets you create ATM solutions and UML examples. Use ConceptDraw DIAGRAM as a UML diagram creator to visualize a banking system.
Process Flow Diagram

 SYSML
SYSML
The SysML solution helps to present diagrams using Systems Modeling Language; a perfect tool for system engineering.
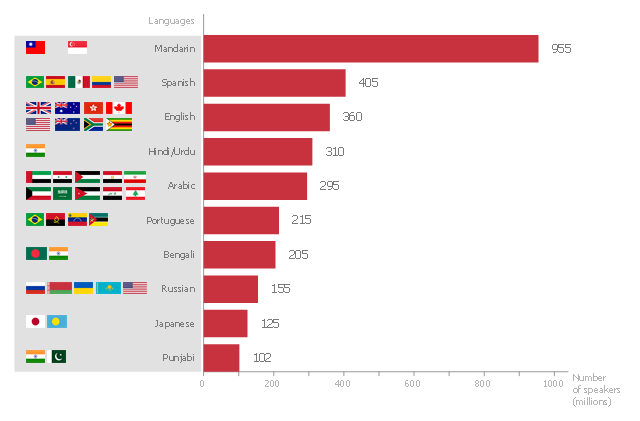
This bar graph sample shows the number of speakers for the most spoken languages of the world.
"In the philosophy of language, a natural language (or ordinary language) is any language which arises in an unpremeditated fashion as the result of the innate facility for language possessed by the human intellect. A natural language is typically used for communication, and may be spoken, signed, or written. Natural language is distinguished from constructed languages and formal languages such as computer-programming languages or the "languages" used in the study of formal logic, especially mathematical logic. ... Though the exact definition varies between scholars, natural language can broadly be defined in contrast on the one hand to artificial or constructed languages, computer programming languages like Python and international auxiliary languages like Esperanto, and on the other hand to other communication systems in nature, such as the waggle dance of bees. Although there are a variety of natural languages, any cognitively normal human infant is able to learn any natural language. By comparing the different natural languages, scholars hope to learn something about the nature of human intelligence and the innate biases and constraints that shape natural language, which are sometimes called universal grammar. The term "natural language" refers only a language that has developed naturally, and hence to actual speech, rather than prescribed speech. Hence, unstandardized speech (such as African American Vernacular English) is natural, whereas standardized speech such as Standard American English, which is in part prescribed, is somewhat artificial." [Natural language. Wikipedia]
The horizontal bar chart example "The most spoken languages of the world" was created using the ConceptDraw PRO diagramming and vector drawing software extended with the Bar Graphs solution from the Graphs and Charts area of ConceptDraw Solution Park.
Horizontal bar graph
 Fishbone Diagrams
The Fishbone Diagrams solution extends ConceptDraw DIAGRAM software with the ability to easily draw the Fishbone Diagrams (Ishikawa Diagrams) to clearly see the cause and effect analysis and also problem solving. The vector graphic diagrams produced using this solution can be used in whitepapers, presentations, datasheets, posters, and published technical material.
 Computer Network Diagrams
Computer Network Diagrams solution extends ConceptDraw DIAGRAM software with samples, templates and libraries of vector icons and objects of computer network devices and network components to help you create professional-looking Computer Network Diagrams, to plan simple home networks and complex computer network configurations for large buildings, to represent their schemes in a comprehensible graphical view, to document computer networks configurations, to depict the interactions between network's components, the used protocols and topologies, to represent physical and logical network structures, to compare visually different topologies and to depict their combinations, to represent in details the network structure with help of schemes, to study and analyze the network configurations, to communicate effectively to engineers, stakeholders and end-users, to track network working and troubleshoot, if necessary.
 Health Informatics
Health Informatics solution supplies the ConceptDraw DIAGRAM with tools and functionalities in a field of healthcare design and healthcare informatics. Including collection of professionally designed samples and a lot of high-quality health informatics vector design objects, it is the best for all medical workers and healthcare-related specialties when designing diagrams, schematics, flow charts, workflow charts, block diagrams, infographics, illustrations, and presentations slides in a field of Health Informatics, representing the newest medical information technologies, architectures of healthcare systems, principles of work of the specialized software, structures of health records systems, medical researches processes.
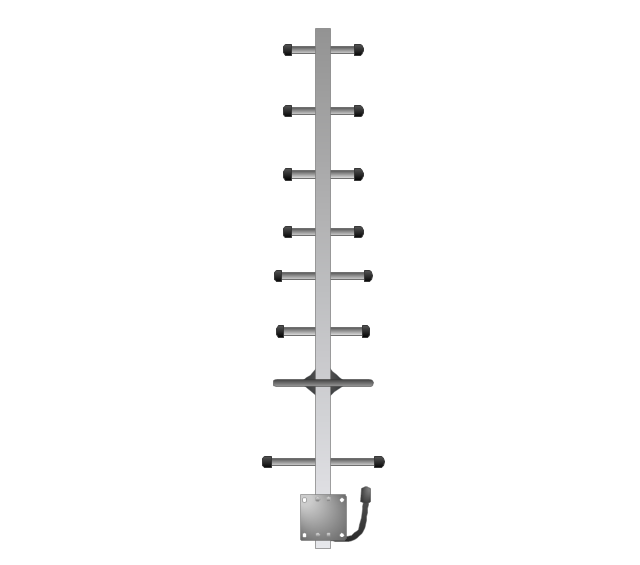
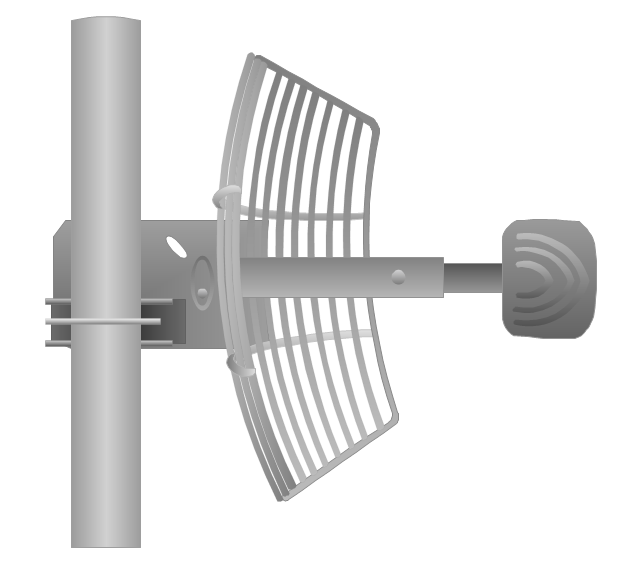
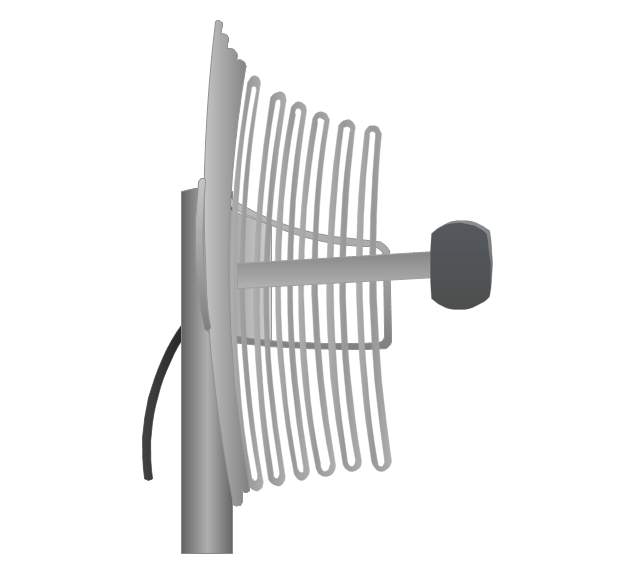
The vector stencils library "Telecom equipment" contains 11 hardware clipart icons of telecommunication devices for drawing computer network diagrams and equipment layouts.
"In telecommunication, a communications system is a collection of individual communications networks, transmission systems, relay stations, tributary stations, and data terminal equipment (DTE) usually capable of interconnection and interoperation to form an integrated whole. The components of a communications system serve a common purpose, are technically compatible, use common procedures, respond to controls, and operate in union. Telecommunications is a method of communication." [Communications system. Wikipedia]
"A basic telecommunication system consists of three primary units that are always present in some form: (1) A transmitter that takes information and converts it to a signal. (2) A transmission medium, also called the "physical channel" that carries the signal. ... (3) A receiver that takes the signal from the channel and converts it back into usable information." [Telecommunication. Wikipedia]
The clip art example "Telecom equipment - Vector stencils library" was created using the ConceptDraw PRO diagramming and vector drawing software extended with the Telecommunication Network Diagrams solution from the Computer and Networks area of ConceptDraw Solution Park.
Andrew multiband high / low power splitter

Andrew multi-band indoor omnidirectional antenna

Panel sector directional antenna

Omni directional antenna

Yagi directional antenna
Yagi integrated downconverter

Grid antenna
Loop antenna
FireTide HotPort® 6000 wireless mesh nodes
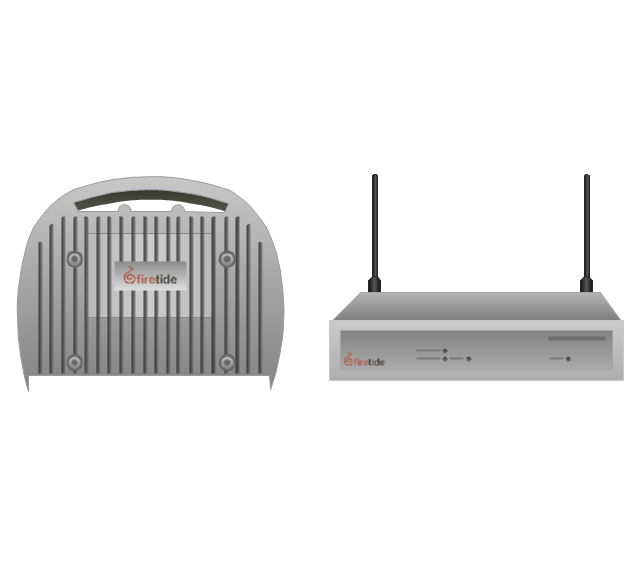
FireTide HotPoint® wireless access point
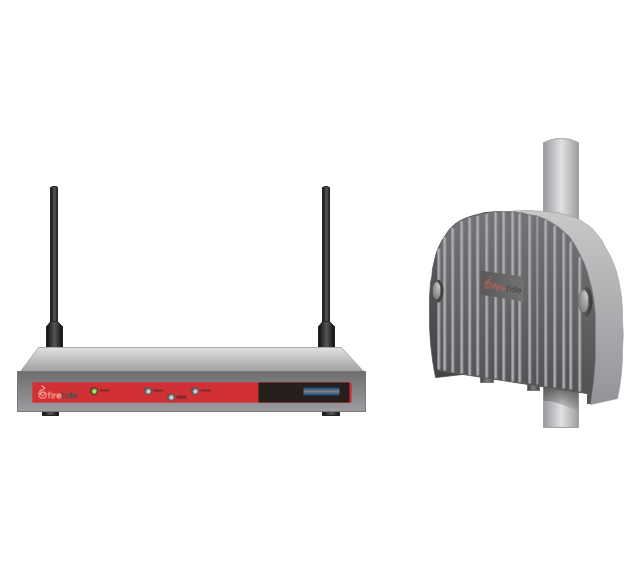
FireTide HotClient Customer Premises Equipment (CPE)
-telecom-equipment---vector-stencils-library.png--diagram-flowchart-example.png)
Credit Card Order Process Flowchart. Flowchart Examples

Accounting Flowchart Symbols

- Simple Communication System Chart
- Flow Chart Of Communication System
- Telecommunication Network Diagrams | Telecommunication ...
- Flow Chart Of Radio Communication
- Explain Various Components Of Data Communication System With ...
- Flow Chart Diagram For Wireless Communication System
- Diagramming Software for Design UML Communication Diagrams ...
- Block Diagram Of Cellular Mobile Communication System
- Layout Diagram Of Wireless Communication Systems
- Telecommunication Network Diagrams | SYSML | Block Diagrams ...
- Flow Chart Of Analog Communication System
- Process Flowchart | Telecommunication Network Diagrams | Basic ...
- Event-driven Process Chain Diagrams | Inter-vehicle communication ...
- Inter-vehicle communication systems | Vehicular Networking ...
- Telecommunication Network Diagrams | GPRS network diagram ...
- Flow Chart Of Satellite Communication
- Diagram And Pie Chart For Wireless Communication
- Flowchart For Wireless Communication
- Transport And Communication Flow Chart
- Draw The Block Diagram Of Digital Communication System