Six Markets Model Chart Template

Six Markets Model Chart

Customizable Six Markets Model Chart Template

A five level pyramid model of different types of Information Systems based on the information processing requirement of different levels in the organization. The first level represents transaction processing systems to process basic data. The second level represents office support systems to process information in office. The third level represents management information systems to process information by managers. The fourth level represents decision support systems to process explicit knowledge. The fifth level represents executive information systems to process tacit knowledge.
"A Computer(-Based) Information System is essentially an IS using computer technology to carry out some or all of its planned tasks. The basic components of computer based information system are:
(1) Hardware - these are the devices like the monitor, processor, printer and keyboard, all of which work together to accept, process, show data and information.
(2) Software - are the programs that allow the hardware to process the data.
(3) Databases - are the gathering of associated files or tables containing related data.
(4) Networks - are a connecting system that allows diverse computers to distribute resources.
(5) Procedures - are the commands for combining the components above to process information and produce the preferred output.
The first four components (hardware, software, database and network) make up what is known as the information technology platform. Information technology workers could then use these components to create information systems that watch over safety measures, risk and the management of data. These actions are known as information technology services." [Information systems. Wikipedia]
This pyramid diagram was redesigned using the ConceptDraw PRO diagramming and vector drawing software from Wikimedia Commons file Five-Level-Pyramid-model.png. [commons.wikimedia.org/ wiki/ File:Five-Level-Pyramid-model.png]
This file is licensed under the Creative Commons Attribution 3.0 Unported license. [creativecommons.org/ licenses/ by/ 3.0/ deed.en]
The triangle chart example "Information systems types" is included in the Pyramid Diagrams solution from the Marketing area of ConceptDraw Solution Park.
Pyramid diagram

Pyramid Diagram

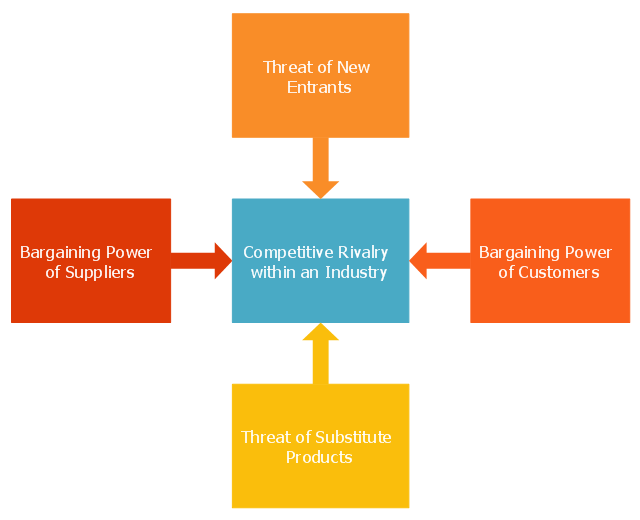
This marketing diagram sample illustrates Porter five forces model. It was designed on the base of the Wikimedia Commons file: Porters five forces.PNG.
[commons.wikimedia.org/ wiki/ File:Porters_ five_ forces.PNG]
This file is licensed under the Creative Commons Attribution-Share Alike 3.0 Unported license. [creativecommons.org/ licenses/ by-sa/ 3.0/ deed.en]
"Porter five forces analysis is a framework for industry analysis and business strategy development. It draws upon industrial organization (IO) economics to derive five forces that determine the competitive intensity and therefore attractiveness of a market. Attractiveness in this context refers to the overall industry profitability. An "unattractive" industry is one in which the combination of these five forces acts to drive down overall profitability. A very unattractive industry would be one approaching "pure competition", in which available profits for all firms are driven to normal profit. This analysis is associated with its principal innovator Michael E. Porter of Harvard University (as of 2014).
Three of Porter's five forces refer to competition from external sources. The remainder are internal threats.
Porter referred to these forces as the micro environment, to contrast it with the more general term macro environment. They consist of those forces close to a company that affect its ability to serve its customers and make a profit. A change in any of the forces normally requires a business unit to re-assess the marketplace given the overall change in industry information. The overall industry attractiveness does not imply that every firm in the industry will return the same profitability. Firms are able to apply their core competencies, business model or network to achieve a profit above the industry average. A clear example of this is the airline industry. As an industry, profitability is low and yet individual companies, by applying unique business models, have been able to make a return in excess of the industry average.
Porter's five forces include - three forces from 'horizontal' competition: the threat of substitute products or services, the threat of established rivals, and the threat of new entrants; and two forces from 'vertical' competition: the bargaining power of suppliers and the bargaining power of customers.
This five forces analysis, is just one part of the complete Porter strategic models. The other elements are the value chain and the generic strategies." [Porter five forces analysis. Wikipedia]
The chart example "Five forces model diagram" was created using the ConceptDraw PRO diagramming and vector drawing software extended with the Marketing Diagrams solution from the Marketing area of ConceptDraw Solution Park.
Marketing chart
Pyramid Diagram

Column Chart Template

Flow Chart Symbols

Circular Flow Diagram Template

Marketing Charts

Pyramid Diagram and Pyramid Chart

Pyramid Chart Examples

Marketing and Sales Organization chart. Organization chart Example

Competitor Analysis

Flowchart design. Flowchart symbols, shapes, stencils and icons


Pyramid Diagram

Model Based Systems Engineering

"Brand essence is a phrase that communicates the fundamental nature of a trade name associated with one or more products made by the same company. A business marketing team will often spend considerable time developing effective ways of expressing the brand essence of their company's various brands by highlighting the unique benefits provided that pertain to the values of its target subculture." [businessdictionary.com/ definition/ brand-essence.html]
Brand essence model diagram visually display key points of brand essence in easy to understand form.
The example of wheel diagram (ring diagram, bevel style circle diagram) "Brand essence model" was created using the ConceptDraw PRO diagramming and vector drawing software extended with the Target and Circular Diagrams solution from the Marketing area of ConceptDraw Solution Park.
www.conceptdraw.com/ solution-park/ marketing-target-and-circular-diagrams
Wheel diagram

Fishbone Diagram Example

- Six Markets Model Chart | Basic Flowchart Examples | Marketing ...
- Relationship marketing | Six Markets Model Chart | Venn Diagram ...
- Network organization chart | Model Based On Lan Man Wan
- Balanced Diet Project Model Chart
- HR Management Software | HR management process - Flowchart ...
- Six Markets Model Chart Template | Basic Flowchart Examples ...
- Block diagram - Six markets model | Six Markets Model Chart ...
- HR Flowcharts | Onboarding model | HR workflow - Vector stencils ...
- 5 Level pyramid model diagram - Information systems types ...
- Six Markets Model Chart | Block diagram - Six markets model | Venn ...
- Six Markets Model Chart | Customer Relationship Management ...
- Six Markets Model Chart | Six Markets Model Chart Template ...
- Draw A System Model For A School System Using Structure Chart
- Pyramid Chart Examples | Top brand model - Pyramid diagram ...
- Brand essence model - Wheel diagram | Competitor Analysis ...
- Sales Flowcharts | Flowchart Example: Flow Chart of Marketing ...
- Six Markets Model Chart | Process Flowchart | Stakeholder ...
- Process Flowchart | Data Flow Diagram Model | Samples of ...
- Competitor Analysis | Positioning Map | Six Markets Model Chart ...
- Six Markets Model Chart | How to Use the ″Online Store PR ...