Organizational Chart
An organizational chart is a diagram that shows the structure of an organization and the relationships of its parts. ConceptDraw DIAGRAM extended with Organizational Charts Solution from the Management Area is powerful Organizational Chart Software.Diagram Software - The Best Choice for Diagramming
For vector shapes and connector tools for quick and easy drawing diagrams for business, technology, science and education - The best choice for Diagramming is ConceptDraw DIAGRAM.Orgchart
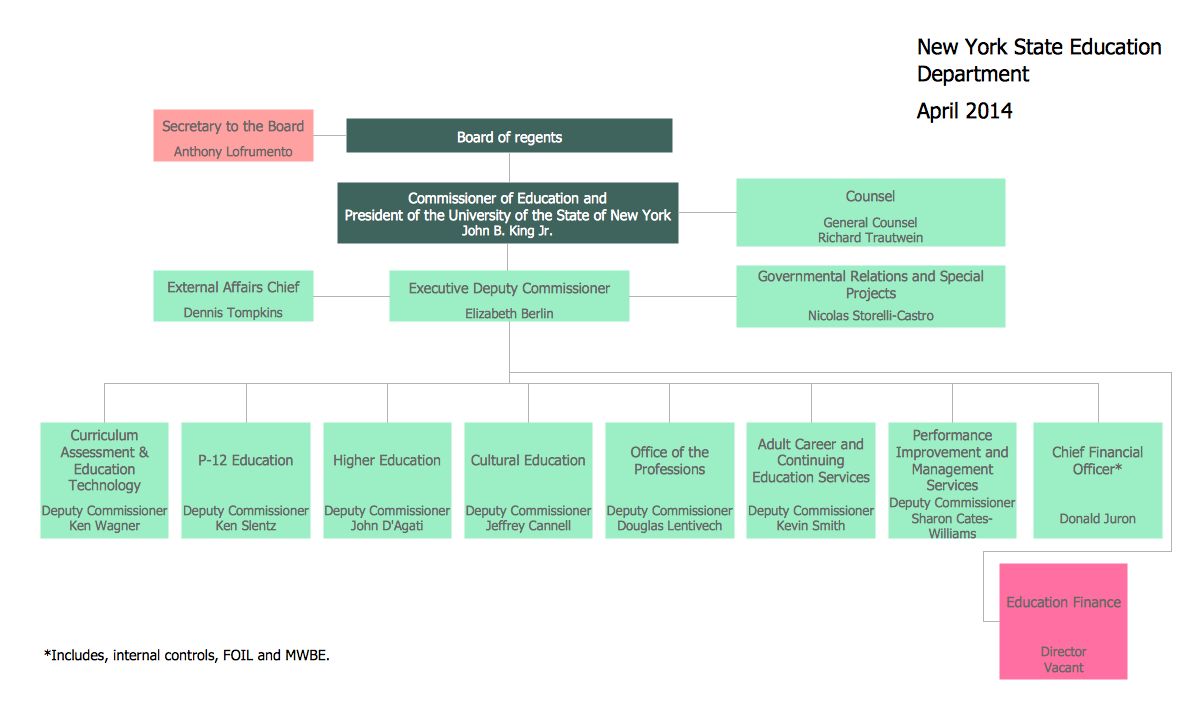
Workforce planning is strategically important for each company, organization, enterprise, and corporation, non important it is business, commercial, non-profit or government organization. Organizational Chart or Orgchart is a type of diagram that is successfully used to graphically illustrate the structure of an organization and also relationships between its parts. There are three different types of Orgcharts: hierarchical, matrix and flat. ConceptDraw DIAGRAM diagramming and vector drawing software supplied with Organizational Charts Solution from Management Area is the best for easy designing professional-looking Orgcharts. This solution provides you the predesigned samples and Organizational Chart library with ready-to-use vector objects required for Orgchart design. It also offers the most simple way of drawing - the possibility to start with one of built-in Orgchart templates. Typically Orgcharts require for regular updating and making modifications, in ConceptDraw DIAGRAM it is fast and easy, the blocks are editable and remain connected when they are moved.Best Diagramming
Need to draw a diagram, process chart, flowchart, organizational chart, graphic design? ConceptDraw can help you to make professional graphic documents quickly.
Organization Chart Software
Create Organizational Chart Software - You need create Organizational Chart? Nothing could be easier with ConceptDraw DIAGRAM diagramming and vector drawing software. ConceptDraw DIAGRAM presents the Organizational Charts Solution from the Management Area that will allow you to draw the Organization Charts of any difficulty easy and quick.
Best Program to Make Flow Chart Diagrams
ConceptDraw the best business process modeling tool to make flow chart diagrams. Start creating your own flowchart with ConceptDraw DIAGRAM and accomplish great results in the moment. This is the best program to make flow chart diagrams that gives users the ability to simply draw any type of flowchart. The fast creating visualization for the structural data with the vector stencils from object libraries by using RapidDraw technology makes ConceptDraw DIAGRAM the first program in drawing flow data.Best Program to Create a Fowchart
ConceptDraw - feature-rich flowchart software allows you create professional looking flowcharts.Basic Diagramming
Create flowcharts, organizational charts, bar charts, line graphs, and more with ConceptDraw DIAGRAM.
ConceptDraw DIAGRAM - Organizational chart software
Organizational Chart is a scheme which visualizes the composition of departments, sectors and other functional units of an organization, and also fixed relationships that exist between divisions and employees. ConceptDraw DIAGRAM enhanced with Organizational Charts solution is a powerful and cost effective Organizational chart software, which allows to automate the process of creation the high standard organizational charts, flow charts, time lines, and much more diagrams. It can be applied for analyzing organizational structure and drawing single or multi-page Organizational Charts with hyperlinks for the companies of any type, size and direction. Visualize the structure using the orgchartal tools, create easily as never before the Company Organizational Chart, Corporate Organizational Chart, Hospital Organizational Chart, University Organizational Chart, Hotel Organizational Chart, and then export, send by e-mail or publish it on Web in minutes, to communicate and discuss with colleagues or any other interested people.Best Diagramming Software for macOS
ConceptDraw DIAGRAM creates drawings, flowcharts, block diagrams, bar charts, histograms, pie charts, divided bar diagrams, line graphs, area charts, scatter plots, circular arrows diagrams, Venn diagrams, bubble diagrams with great visual appeal on Mac OS X.
Organizational Structure
The organizational structure reflects the composition and hierarchy of company's divisions, determines the distribution of authorities and responsibilities within the organization, and facilitates the understanding by workers their responsibilities. It also defines the group of people making key decisions at the company. Visualization of organizational structure of any company, organization or institution is not an easy task, because sometimes the company may include several departments, each with more than thousand persons. For such large organizations often are created the Organizational charts for every department separately. There are many ways of organization's structuring, which determine its work. Often happens that organizational structure adapts to production process. ConceptDraw DIAGRAM extended with unique Organizational Charts solution from Management area of ConceptDraw Solution Park is a powerful organizational structure software, which ideally suits for developing Organizational Charts of any type and any complexity.The Best Drawing Program for Mac
ConceptDraw DIAGRAM is the professional business graphic software for drawing diagrams and charts with great visual appeal on Mac OS X.Software for Drawing EPC Diagrams
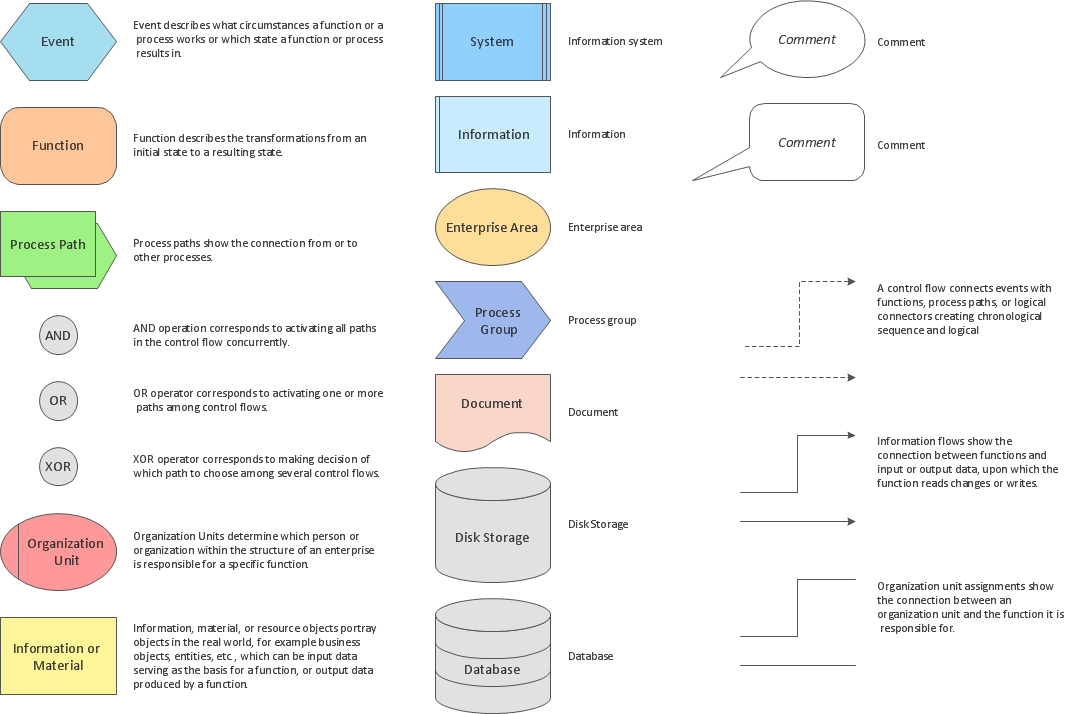
Event-Driven Process chain Diagrams for improvement throughout an organisation. ConceptDraw DIAGRAM - software that reduces the time needed to create a business process model.Bar Chart Software
The best bar chart software ever is ConceptDraw. ConceptDraw bar chart software provides an interactive bar charting tool and complete set of predesigned bar chart objects.Influence Diagram Software
Influence diagram (ID) is a graphical and mathematical representation of the decision. Influence diagrams are widely used in the decision analysis and in the game theory. They are the alternative to the decision tree. The influence diagram gives to analyst the high-level conceptual view that it can use to build the detailed quantitative model. This sample shows the Influence diagram. It is a directed acyclic graph with three types of nodes: Decision node is drawn as a rectangle, Uncertainty node is drawn as an oval, Value node is drawn as an octagon. The nodes are connected with arcs.Gantt Chart Templates
Gantt Chart Templates - PM Easy Solution from the Project Management Area extends ConceptDraw PROJECT with the ability to quickly start a project. It lists task dependencies and relationships making the terative planning easy. ConceptDraw PROJECT lets you the useful possibility to create visual project dashboards and diagrams, generate various kinds of reports with one click. It provides also extensive capabilities of importing and exporting in various formats: Microsoft Project, ConceptDraw MINDMAP , Mindjet MindManager, PDF file.Classroom Seating Chart Maker
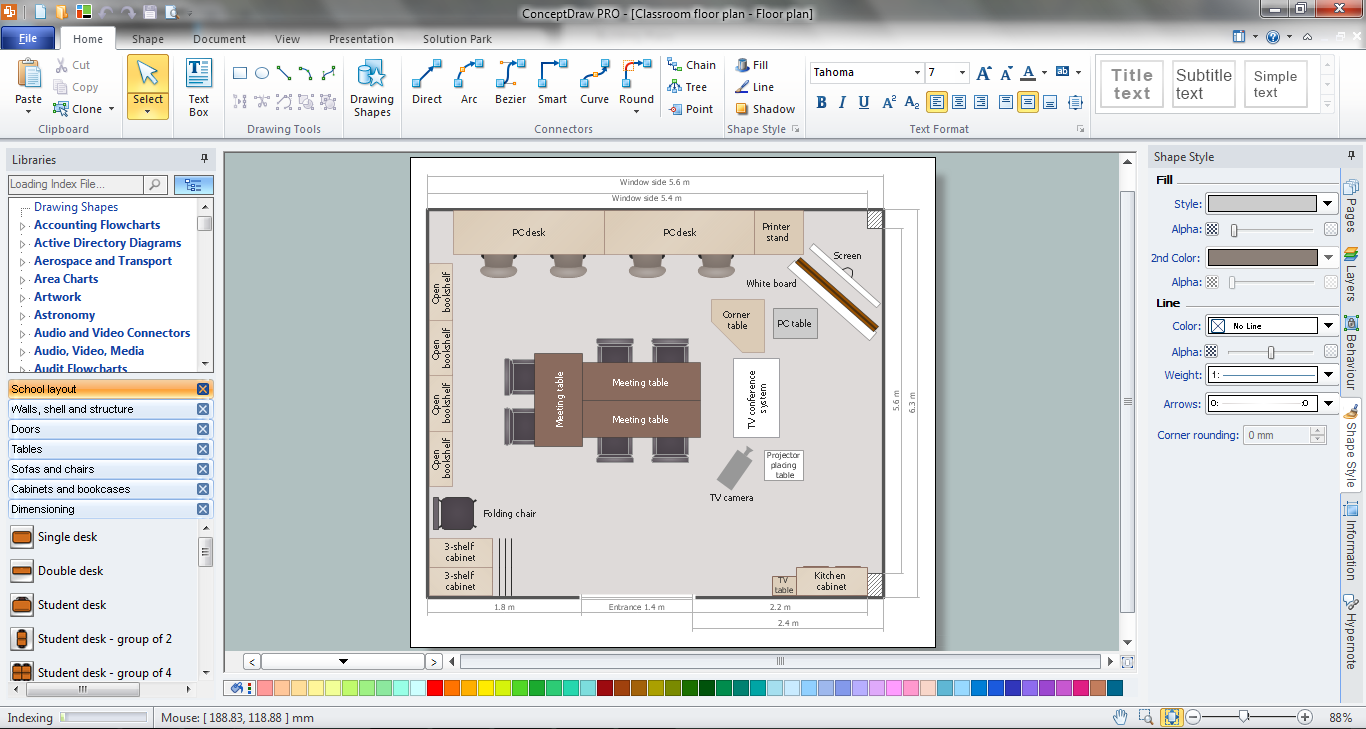
ConceptDraw DIAGRAM extended with School and Training Plans Solution from the Building Plans Area is a powerful Classroom Seating Chart Maker.Relative Value Chart Software
Relative value is a value measured in the terms of liquidity, risks, return of one investment or financial instrument relative to another. Relative values are widely used in:business, economics, investment, management, marketing, statistics, etc. ConceptDraw DIAGRAM software is the best for drawing professional looking Relative Value Charts. ConceptDraw DIAGRAM provides Divided Bar Diagrams solution from the Graphs and Charts Area of ConceptDraw Solution Park.- | Diagram Software - The Best Choice for Diagramming ...
- Diagram Software - The Best Choice for Diagramming | Mac Org ...
- Diagram Software - The Best Choice for Diagramming | Cubetto ...
- ConceptDraw DIAGRAM - Organizational chart software | Draw ...
- Organogram Software | Organizational Chart Templates | Orgchart ...
- Organizational Chart Templates | 25 Typical Orgcharts ...
- Business diagrams & Org Charts with ConceptDraw DIAGRAM ...
- Organizational chart - University leadership | Organizational Charts ...
- Diagram Software - The Best Choice for Diagramming | The Best ...
- Diagram Software - The Best Choice for Diagramming ...
- Organizational Charts | Organizational chart - University leadership ...
- Diagram Software - The Best Choice for Diagramming | Business ...
- Diagram Software - The Best Choice for Diagramming | Bubble ...
- Org Chart Diagram | How to Draw an Organization Chart | Matrix ...
- Diagram Software - The Best Choice for Diagramming | Prepare ...
- How to Draw an Organization Chart | Matrix Organization ...
- Diagram Software - The Best Choice for Diagramming | Good Flow ...
- Diagram Software - The Best Choice for Diagramming | How to Draw ...
- Circle-Spoke Diagrams | Organizational Charts | Diagram Software ...
- Food Court | Organizational Structure Diagram Software | The Best ...


