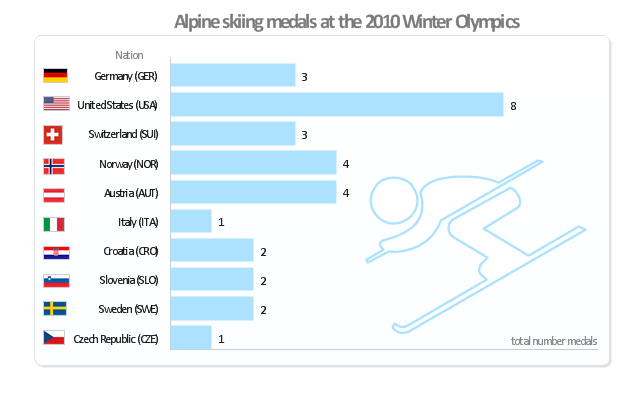
"Alpine skiing at the 2010 Winter Olympics was held at Whistler Creekside in Whistler, British Columbia, Canada. The ten events were scheduled for 13–27 February, 2010; weather delayed the first event, the men's downhill, two days until Monday, 15 February. ... Notably absent from the medals in these Olympics were the Austrian men, who had won 8 medals in 2006 and 7 in 2002. France and host Canada were shut out from the podium, as were the German men and the Swiss and Italian women. The U.S. had its best Olympics ever with eight alpine medals, only the fourth nation to achieve that total in a single Olympics (Austria, France, Switzerland). Individually, three men and five women won multiple medals; triple medalists were Bode Miller of the U.S. and Aksel Lund Svindal of Norway, who both won a medal of each color. The sole double gold medalist was Maria Riesch of Germany." [Alpine skiing at the 2010 Winter Olympics. wikipedia]
This medal bar chart example "Alpine skiing at the 2010 Winter Olympics" was created using the ConceptDraw PRO diagramming and vector drawing software extended with the Winter Sports solution.
The Winter Sports solution from the Sport area of ConceptDraw Solution Park contains the vector stencils library "Winter sports pictograms" and examples of diagrams and infographics.
Medal bar chart
 Bar Graphs
Bar graphs solution extends ConceptDraw PRO software with templates, samples and library of vector stencils for drawing the bar charts.
 Divided Bar Diagrams
Divided bar diagrams solution extends ConceptDraw PRO software with templates, samples and library of vector stencils for drawing the divided bar charts.
 Composition Dashboard
Composition dashboard solution extends ConceptDraw PRO software with templates, samples and vector stencils library with charts and indicators for drawing visual dashboards showing data composition.
 ConceptDraw Solution Park
ConceptDraw Solution Park collects graphic extensions, examples and learning materials
 Winter Sports
The Winter Sports solution from Sport area of ConceptDraw Solution Park contains winter sports illustration examples, templates and vector clipart libraries.
 What is a Dashboard Area
Solutions from the area What is a Dashboard of ConceptDraw Solution Park collects templates, samples and vector stencils libraries with of data driven charts and indicators for drawing the basic types of Visual Dashboards.
 Comparison Dashboard
Comparison dashboard solution extends ConceptDraw PRO software with samples, templates and vector stencils library with charts and indicators for drawing the visual dashboard comparing data.
 Time Series Dashboard
Time series dashboard solution extends ConceptDraw PRO software with templates, samples and vector stencils libraries with charts, graphs and plots for drawing the visual dashboards showing data time series.
 Area Charts
Area charts solution extends ConceptDraw PRO with templates, samples and library of vector stencils for drawing the area graphs.
 Organizational Charts
Organizational Charts solution extends ConceptDraw PRO software with samples, templates and library of vector stencils for drawing the org charts.
 Pie Charts
Pie Charts solution extends ConceptDraw PRO software with templates, samples and library of vector stencils for drawing the pie and donut charts.
 Picture Graphs
Picture Graphs solution extends ConceptDraw PRO software with templates, samples and library of vector stencils for drawing the picture charts.
 Cross-Functional Flowcharts
Cross-functional flowcharts are powerful and useful tool for visualizing and analyzing complex business processes which requires involvement of multiple people, teams or even departments. They let clearly represent a sequence of the process steps, the order of operations, relationships between processes and responsible functional units (such as departments or positions).
 Seven Basic Tools of Quality
Manage quality control in the workplace, using fishbone diagrams, flowcharts, Pareto charts and histograms, provided by the Seven Basic Tools of Quality solution.
 25 Typical Orgcharts
The 25 Typical Orgcharts solution contains powerful organizational structure and organizational management drawing tools, a variety of professionally designed organization chart and matrix organization structure samples, 25 templates based on various orga
 Histograms
Histograms solution extends ConceptDraw PRO software with templates, samples and library of vector stencils for drawing the histograms to visualize the frequency distribution of data.
 Holiday
The Holiday Solution from Illustration area of ConceptDraw Solution Park contains holiday illustration examples, templates and vector clipart library.
 Seven Management and Planning Tools
Seven Management and Planning Tools solution extends ConceptDraw PRO and ConceptDraw MINDMAP with features, templates, samples and libraries of vector stencils for drawing management mind maps and diagrams.
- Winter Sports | Sport Field Plans | ConceptDraw Solution Park | Bar ...
- Cafe and Restaurant Floor Plan | Winter Sports | Sport Field Plans ...
- Alpine skiing medals at the 2010 Winter Olympics - Infographics with ...
- How to Create a Bar Chart | Double Bar Graph With The Width
- How to Create a Bar Chart | Double Bar Graph Then Enter Values ...
- ConceptDraw PRO Compatibility with MS Visio | Bar Diagrams for ...
- Step Area Graph | Area chart | Graphs and Charts Area | Area Graph
- Medal bar chart
- London election results - Divided bar diagram | What is a Dashboard ...
- Winter Olympics - Alpine skiing | Winter Sports. Illustrations and ...
- Design elements - Winter sports pictograms | Winter Sports | Alpine ...
- Bar Graphs | ConceptDraw Solution Park | Picture Graphs | Top ...
- Christmas and New Year | New Year card template - Christmas ...
- Horizontal bar chart - The most spoken languages of the world | Bar ...
- Winter Olympics - Alpine skiing | Alpine skiing medals at the 2010 ...
- Winter Sports | Winter Sports Vector Clipart. Medal Map. Spatial ...
- Alpine skiing, paralympic - Winter sports pictograms | Alpine skiing ...
- Sochi 2014 Olympics medal count | Winter Sports. Olympic Games ...
- Alpine skiing medals at the 2010 Winter Olympics - Infographics with ...
- Sports bar - Floor plan | Cafe and Restaurant Floor Plan | Sports bar ...