This site uses cookies. By continuing to browse the ConceptDraw site you are agreeing to our Use of Site Cookies.

Scientific Symbols Chart

ConceptDraw DIAGRAM is the beautiful design software that provides many vector stencils, examples and templates for drawing different types of illustrations and diagrams.


Mathematics Solution from the Science and Education area of ConceptDraw Solution Park includes a few shape libraries of plane, solid geometric figures, trigonometrical functions and greek letters to help you create different professional looking mathematic illustrations for science and education.

The Action Plan

Action Plan - For the action planning define people and groups involvement in corrective actions by roles, identify logical sequences of scheduled actions and critical path of problem solving, identify possible risks of action plan and propose preventive actions.
ConceptDraw Office suite is a software for decision making and action plan.
7MP Tools
7MP Tools

Affinity Diagram

The affinity diagram is a business tool used to organize ideas and data. It is one of the Seven Management and Planning Tools. But how design the Affinity Diagram quick and easy? ConceptDraw DIAGRAM diagramming and vector drawing software offers the Seven Management and Planning Tools Solution from the Management Area.

PROBLEM ANALYSIS. Identify and Structure Factors

Identify and Structure Factors. Use the Affinity Diagram to collect and structure factors that impact on a problem.
ConceptDraw OFFICE suite is a software for identify and structure factors with affinity diagram. This is a grouping and structuring of factors that impact on a problem.
7MP Tools
7MP Tools

Biology Symbols

ConceptDraw DIAGRAM diagramming and vector drawing software extended with Biology solution from the Science and Education area offers a set of useful tools for fast and easy drawing of various biology illustrations and drawings.

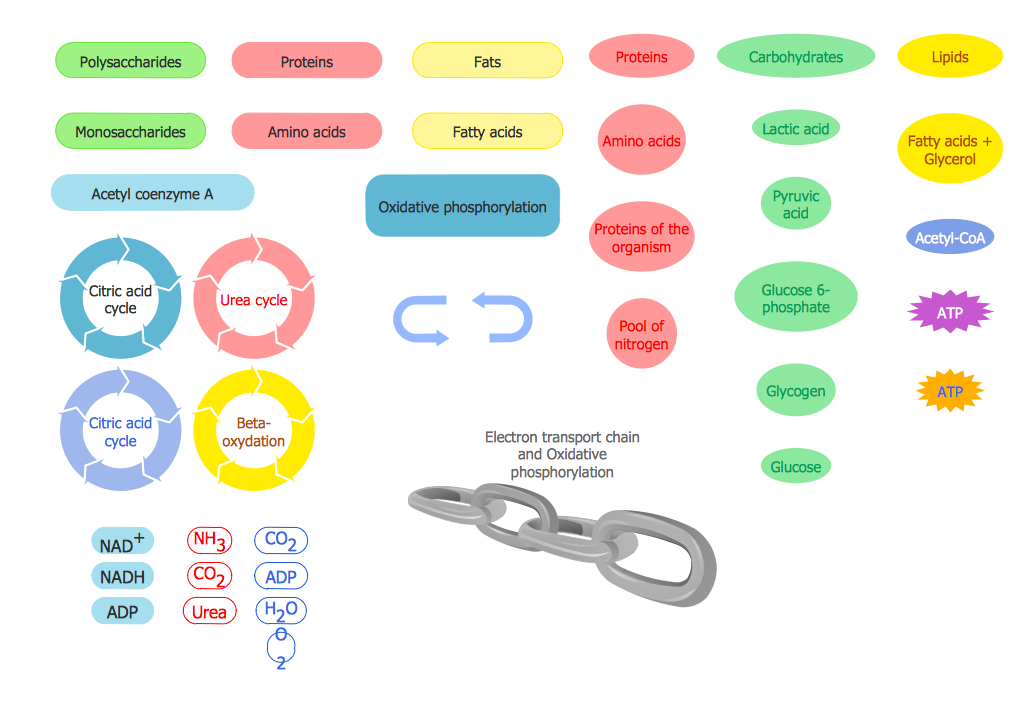
Biology solution provides 3 libraries with large quantity of vector biology symbols: Biochemistry of Metabolism Library, Carbohydrate Metabolism Library, Citric Acid Cycle (TCA Cycle) Library.

Affinity Diagram

The Affinity Diagram shows the structure of large, complex factors that have an influence on a problem, and then divides them up into a smaller and simpler structure. The Affinity Diagram does not show a causal relationship between the factors. This diagram is designed to prepare the data for further analysis of the cause-effect relationships.

Decision Making

Decision Making - ConceptDraw OFFICE suite provides visual tools that are given support on the stage of the decision making.
The Seven Management and Planning Tools is a set for such diagrams: Affinity Diagram, Relations Diagram, Prioritization Matrix, Root Cause Tree Diagram, Involvement Matrix, PERT Chart, Risk Diagram (PDPC).

How to Draw Business Process Diagrams with RapidDraw Interface

Business Process Modeling Notation (BPMN) is a set of standard symbols that allow you to create a graphical view of a business process. The symbols were developed to help users develop standard, unified structure of processes, and any messages shared between these processes.

CORRECTIVE ACTIONS PLANNING. Risk Diagram (PDPC)

Risk Diagram (PDPC) - ConceptDraw OFFICE suite is a software for Risks Diagram making. This diagram identifies possible risks in accomplishing corrective actions. With the Risks Diagram, one analyzes each action separately in a tree of all actions and develops a preventive action in response of each potential obstacles or circumstances which may be a risk.
7MP Tools
7MP Tools

Workflow Diagram

Workflow diagram visually describes an repeatable pattern of organizational activity powered by resources. Workflow diagram explains and document the process flow which needs to be organized or exists and needs to be learned and executed. Workflow diagram can be part of project documentation, company policies or sertification process to comply a standard.

The workflow represents the transferring of data, documents or tasks during a work process. To make it easier to study and analyze working processes, and to present them in a simple visual manner, workflow diagrams are used. To create these diagrams professional use workflow diagram maker software ConceptDraw DIAGRAM.

Organizational Charts with ConceptDraw DIAGRAM

With ConceptDraw DIAGRAM, you can quickly and easily create any type of orgchart professional. ConceptDraw DIAGRAM includes numerous organizational chart templates for the simple to complex multi-page charts.

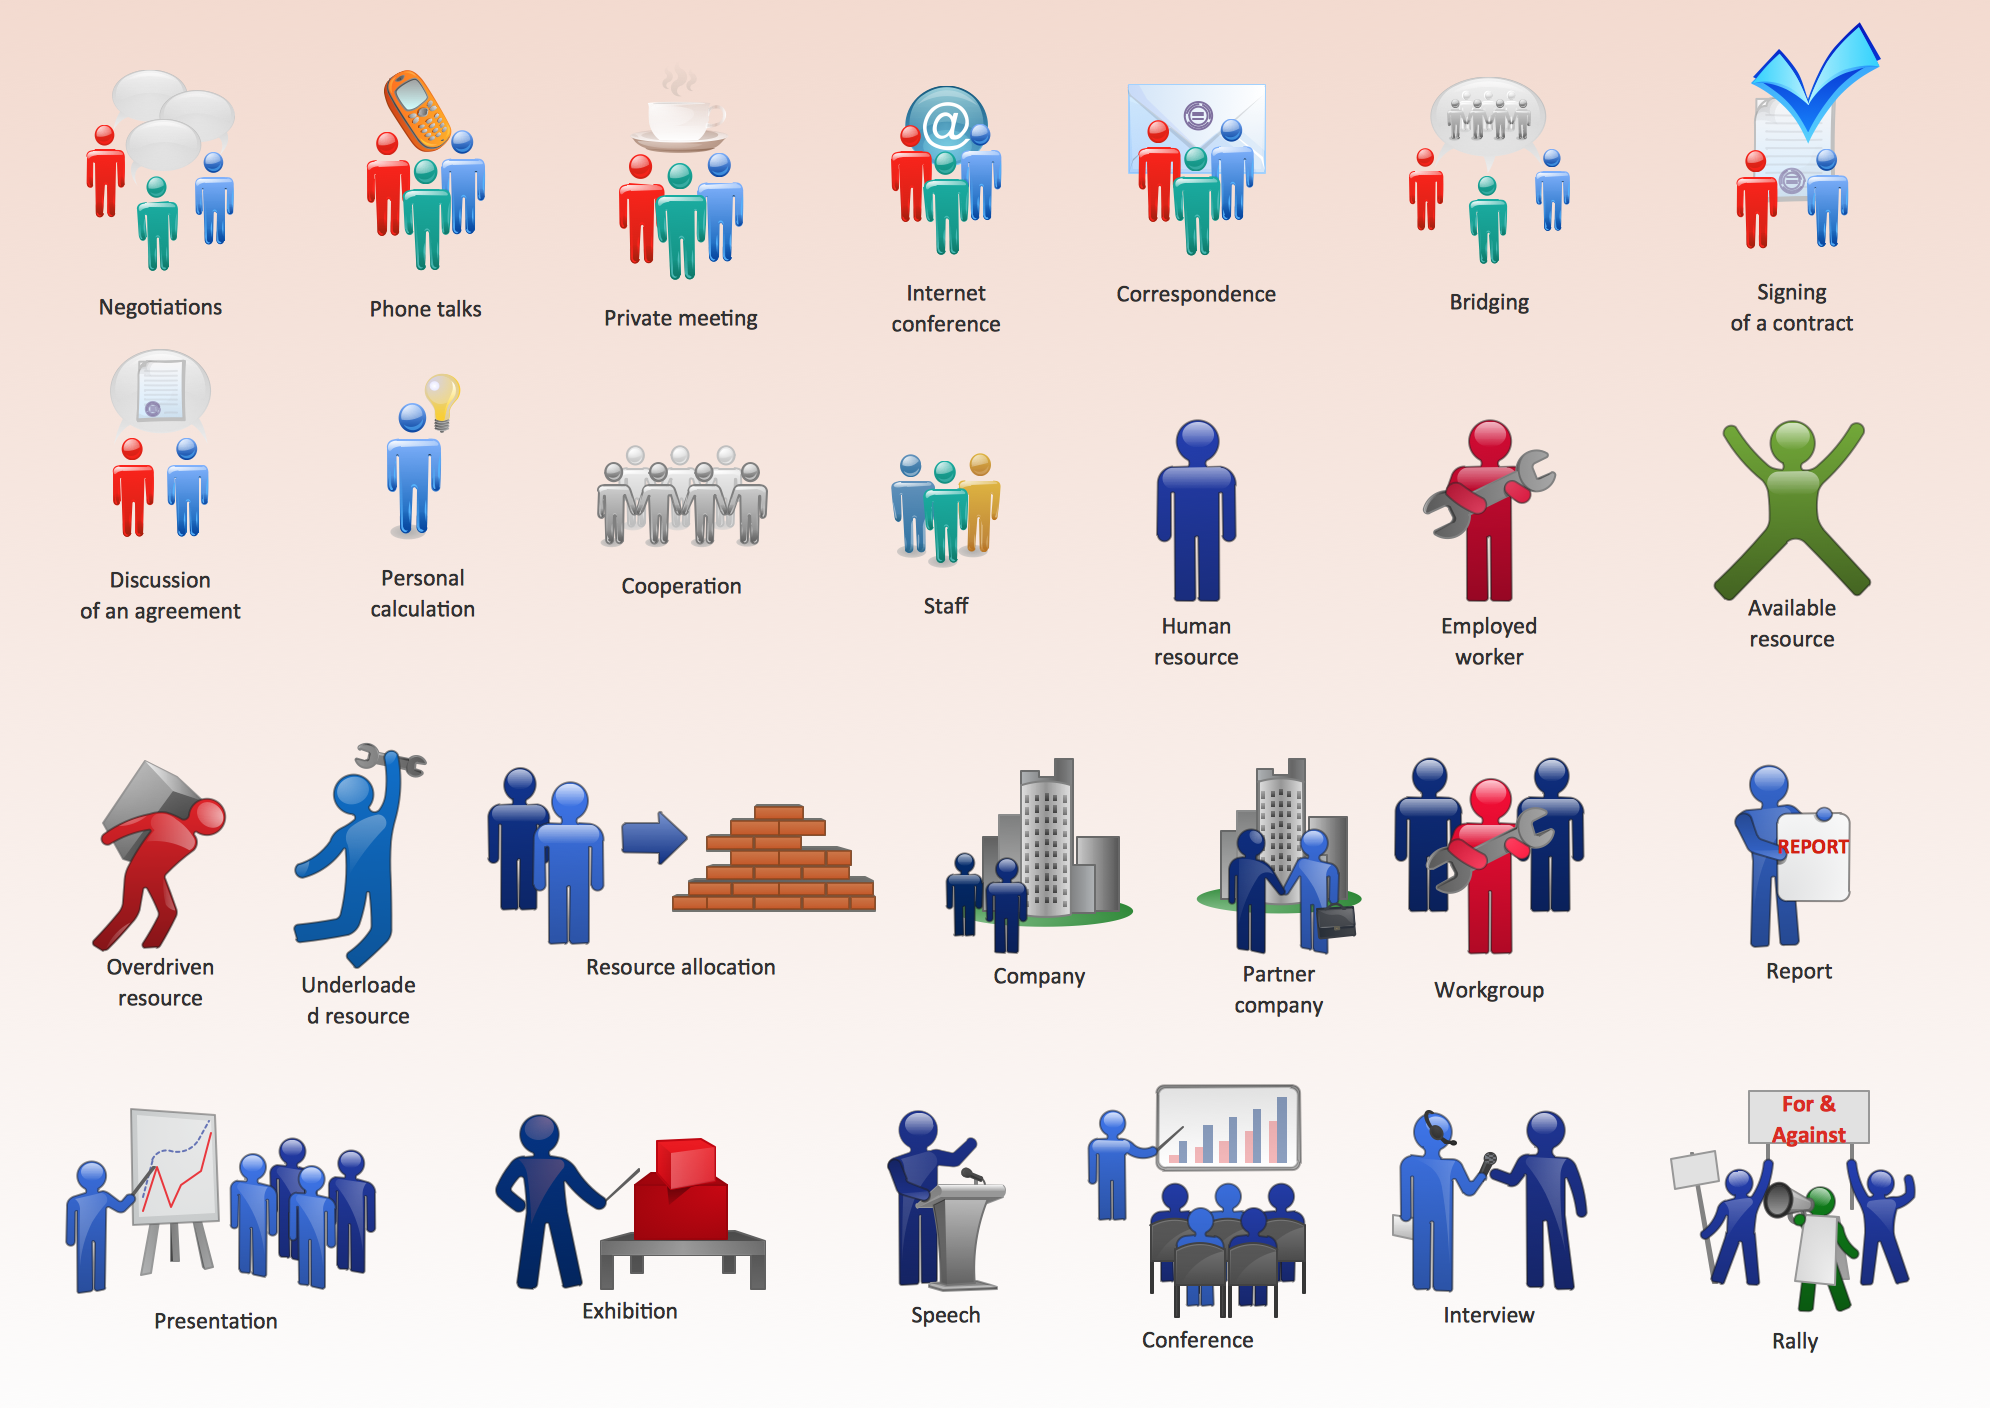
Business People Figures

Nowdays business people’s figures are most favourite vector illustrations among presenters and designers. It is easy to make them and use, but they can make your graphics look really good looking & eye catching.

Just check ConceptDraw business perople figusers pictures, you will see all kinds of silhouetes: Staff, Employed workers, Persons and Groups symbols.

Best popular vector pictures are: men, dancing people, business man.

Use human contours wise and it will help you to tell main idea of your design message.

Influence Diagram Software

Influence diagram (ID) is a graphical and mathematical representation of the decision. Influence diagrams are widely used in the decision analysis and in the game theory. They are the alternative to the decision tree. The influence diagram gives to analyst the high-level conceptual view that it can use to build the detailed quantitative model.
This sample shows the Influence diagram. It is a directed acyclic graph with three types of nodes: Decision node is drawn as a rectangle, Uncertainty node is drawn as an oval, Value node is drawn as an octagon. The nodes are connected with arcs.

Cause and Effect Analysis

Cause and Effect Analysis - The Seven Management and Planning Tools is a tool for Cause and Effect Analysis that allows users to analyze the root causes for factors that influenced the problem. This diagram is constructed separately for each highly prioritized factor. The Diagram is then used for further formulation of potential actions.
7MP Tools
7MP Tools

Pyramid Diagram and Pyramid Chart

Pyramid Diagram is very useful to illustrate the foundation-based relationships. ConceptDraw DIAGRAM, a business charting software, includes some build-in symbols for designer to draw all kind of the pyramid diagrams.