Affinity Diagram Software
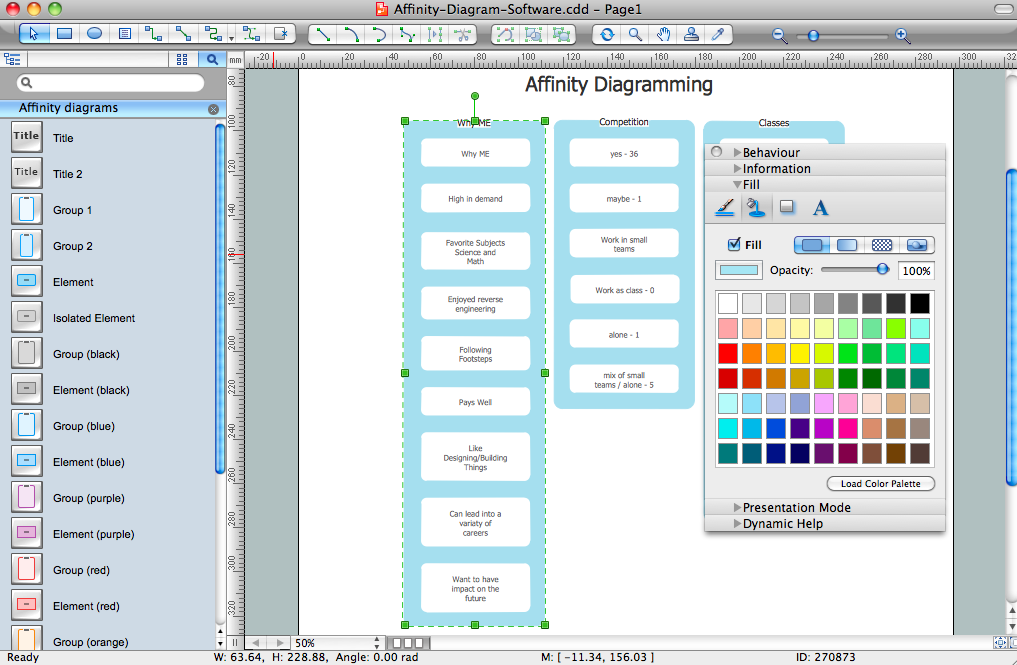
Affinity Diagram Software - ConceptDraw PRO is a powerful diagramming and vector drawing software that allows quick, easy and effective create the Affinity Diagrams. Seven Management and Planning Tools solution from the Business Productivity area of ConceptDraw Solution Park provides templates, samples and ready-to-use vector stencils that will help you design the professional looking Affinity Diagrams in a few moments.HelpDesk
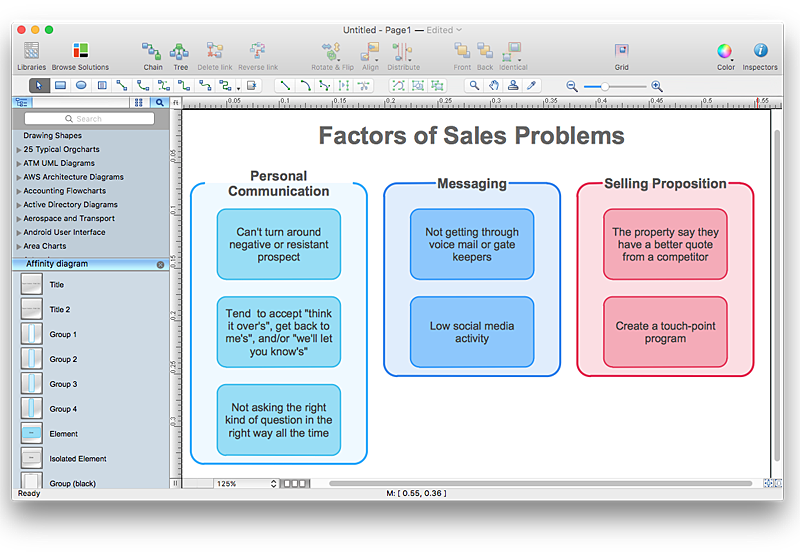
How To Create an Affinity Diagram Using ConceptDraw Office
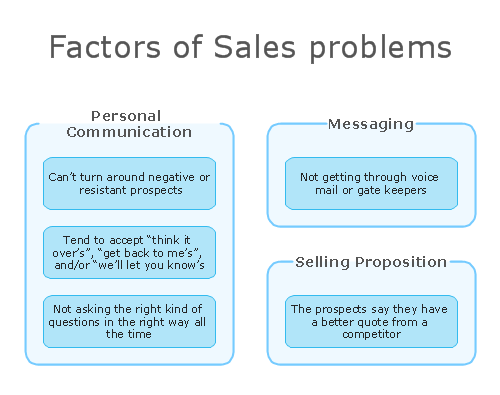
Affinity diagram is designed to prepare the data for further analysis of the cause-effect relationships.The Affinity diagram shows the structure of large, complex factors that have an influence on a problem, and then divides them up into a smaller and simpler structure. We recommend using a mind map for Brainstorming and collecting the factors affecting the problem. The ability to create an Affinity diagram from a mind map is supported by the ConceptDraw Seven Management and Planning Tools solution.Affinity Diagram
The Affinity Diagram, also known as a KJ diagram, is a business tool invented for organization the large quantity of ideas and data. It is a part of Seven Management and Planning Tools, it is usually used right after brainstorming to sort large numbers of ideas into the corresponding groups. The Affinity Diagram helps to represent in a better way the structure of large and complex factors which influence on a problem, divides these factors into the smaller and simpler structures, and helps team members to see the patterns and identify possible solutions to problems they have. The diagrams of this type don't show the causal relationships between the factors, but they are designed to prepare the data for holding further analysis of the cause-effect relationships. Another area of Affinity Diagram usage is contextual inquiry as a way to sort observations and notes from field interviews, support call logs, open-ended survey responses organizing, etc. ConceptDraw MINDMAP software offers you the tools for easy holding brainstorming, generation ideas and creation MINDMAP Affinity Diagram.Affinity Diagram
Affinity Diagram is a powerful business tool, one of the Seven Management and Planning Tools. It helps to gather and organize in groups the large number of information, opinions or ideas, which are typically generated during brainstorming session, and is based on the natural relationships that exist between ideas. Affinity Diagram is indispensible for analysis the complex problems, ideas and results of oral surveys. It effectively depicts the structure of large and complex factors that influence on a problem, divides them into smaller with simpler structure, but doesn't show a causal relationship between the factors. Typically Affinity Diagram contains approximately 40-50 topics and is widely used for a completely different goals, for the project definition, for analyzing product evaluations, for identifying the main violations in a process and the ways of their improvement. ConceptDraw Office applications are ideal for designing professional-looking Affinity diagrams. This Affinity diagram is created to prepare the data for further analysis of cause-and-effect relationships.Affinity Diagram
The affinity diagram is a business tool used to organize ideas and data. It is one of the Seven Management and Planning Tools. But how design the Affinity Diagram quick and easy? ConceptDraw PRO diagramming and vector drawing software offers the Seven Management and Planning Tools Solution from the Management Area.PROBLEM ANALYSIS. Identify and Structure Factors
Identify and Structure Factors. Use the Affinity Diagram to collect and structure factors that impact on a problem. ConceptDraw Office suite is a software for identify and structure factors with affinity diagram. This is a grouping and structuring of factors that impact on a problem.
Problem Analysis
ConceptDraw Office suite is a software for Problem Analysis. The Seven Management and Planning Tools are a set of such tools for investigating complex problems. These tools are exemplary at organizing research, parsing complex problems, providing a structure for the details, helping managers make decisions, and organizing effective communications in a visual manner that keeps everyone involved
"A continual improvement process, also often called a continuous improvement process (abbreviated as CIP or CI), is an ongoing effort to improve products, services, or processes. These efforts can seek "incremental" improvement over time or "breakthrough" improvement all at once. Delivery (customer valued) processes are constantly evaluated and improved in the light of their efficiency, effectiveness and flexibility.
Some see CIPs as a meta-process for most management systems (such as business process management, quality management, project management, and program management)." [Continual improvement process. Wikipedia]
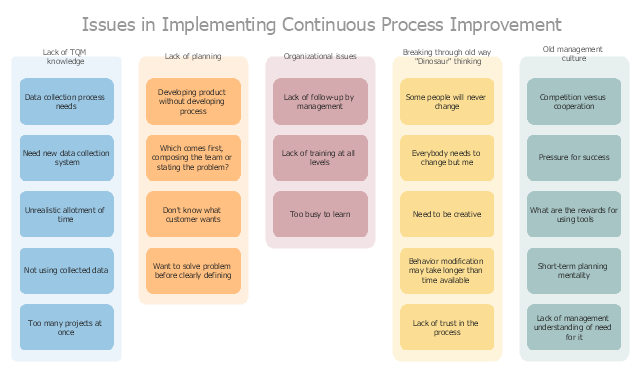
The affinity diagram example "Implementing continuous process improvement" was created using the ConceptDraw PRO diagramming and vector drawing software extended with the solution "Seven Management and Planning Tools" from the Management area of ConceptDraw Solution Park.
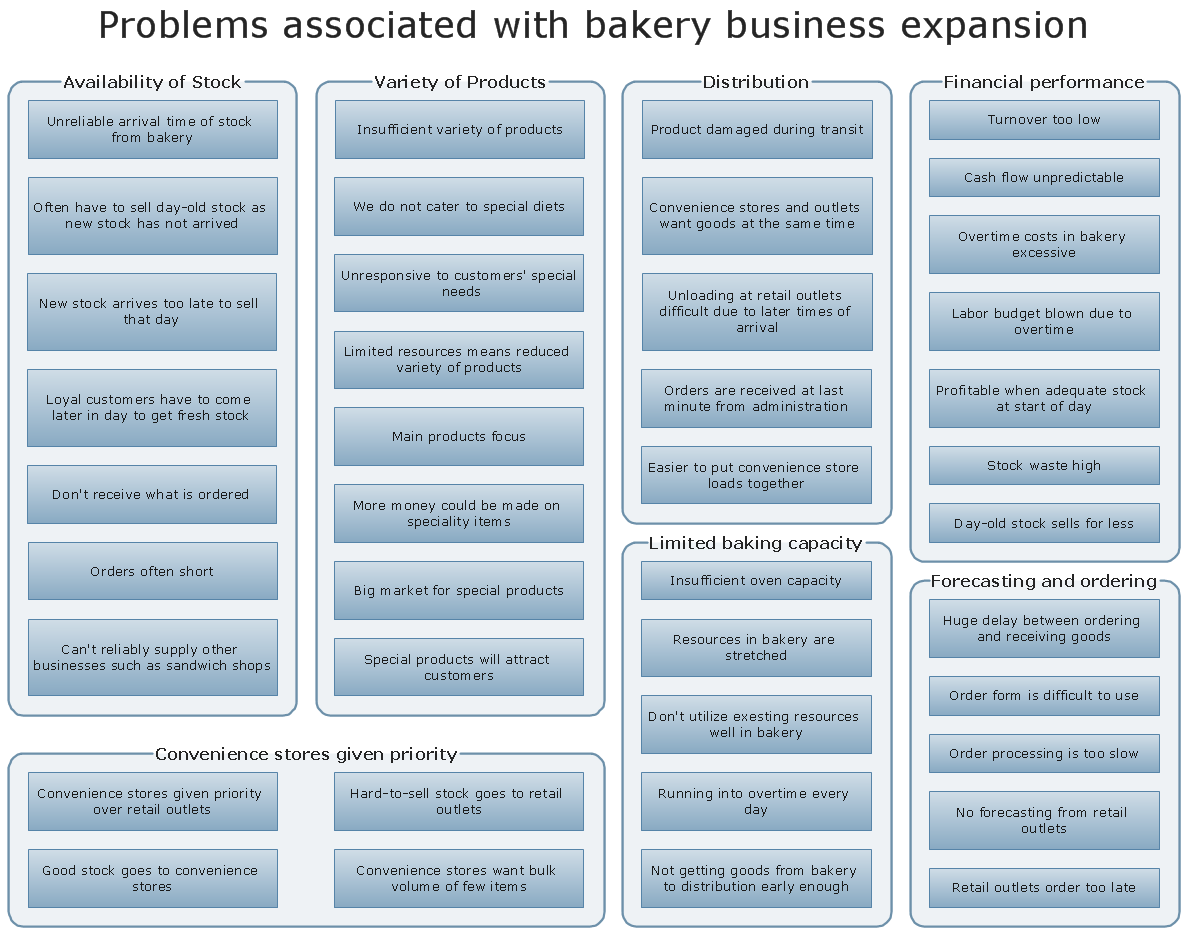
The affinity diagram shows the structure of complex factors that have an influence on a problem, and then divides them up into a smaller and simpler structure. This diagram is designed to prepare the data for further analysis of the cause-effect relationships.
"Affinity diagrams are a special kind of brainstorming tool that organize large amounts of disorganized data and information into groupings based on natural relationships.
It was created in the 1960s by the Japanese anthropologist Jiro Kawakita. Its also known as KJ diagram,after Jiro Kawakita.When to Use an Affinity Diagram: 1) When you are confronted with many facts or ideas in apparent chaos. 2) When issues seem too large and complex to grasp." [Seven Management and Planning Tools. Wikipedia]
The affinity diagram is one of the Seven Management and Planning Tools (7 MP tools, Seven New Quality Tools).
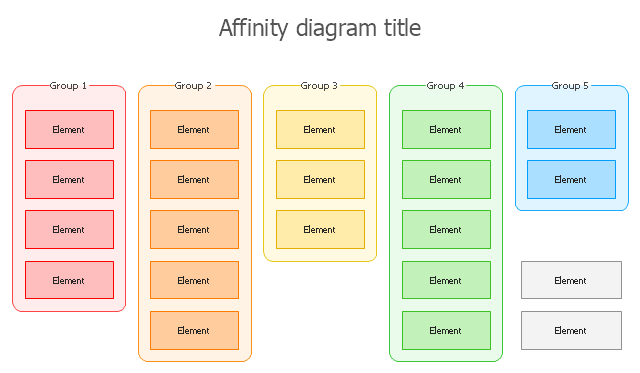
The affinity diagram template for the ConceptDraw PRO diagramming and vector drawing software is included in the solution "Seven Management and Planning Tools" from the Management area of ConceptDraw Solution Park.
Decision Making
Decision Making - ConceptDraw Office suite provides visual tools that are given support on the stage of the decision making. The Seven Management and Planning Tools is a set for such diagrams: Affinity Diagram, Relations Diagram, Prioritization Matrix, Root Cause Tree Diagram, Involvement Matrix, PERT Chart, Risk Diagram (PDPC).
- Best Affinity Diagram Tools Online
- Affinity Diagram | Venn Diagram Examples for Problem Solving ...
- Affinity Diagram | Affinity Diagram | How To Create an Affinity ...
- Affinity Diagram | How To Create an Affinity Diagram Using ...
- Seven Management and Planning Tools | Affinity diagram ...
- PROBLEM ANALYSIS. Root Cause Analysis Tree Diagram | Affinity ...
- Affinity Diagram Software | Affinity Diagram | Affinity Diagram | Pdf ...
- Affinity diagram - Implementing continuous process improvement ...
- Affinity Diagram | Types of Flowcharts | Life cycle analysis - Ring ...
- Affinity Diagram | Affinity Diagram | Prioritization Matrix | Affinity ...
