Affinity Diagram

Affinity Diagram

Learn how to create a current state value stream map

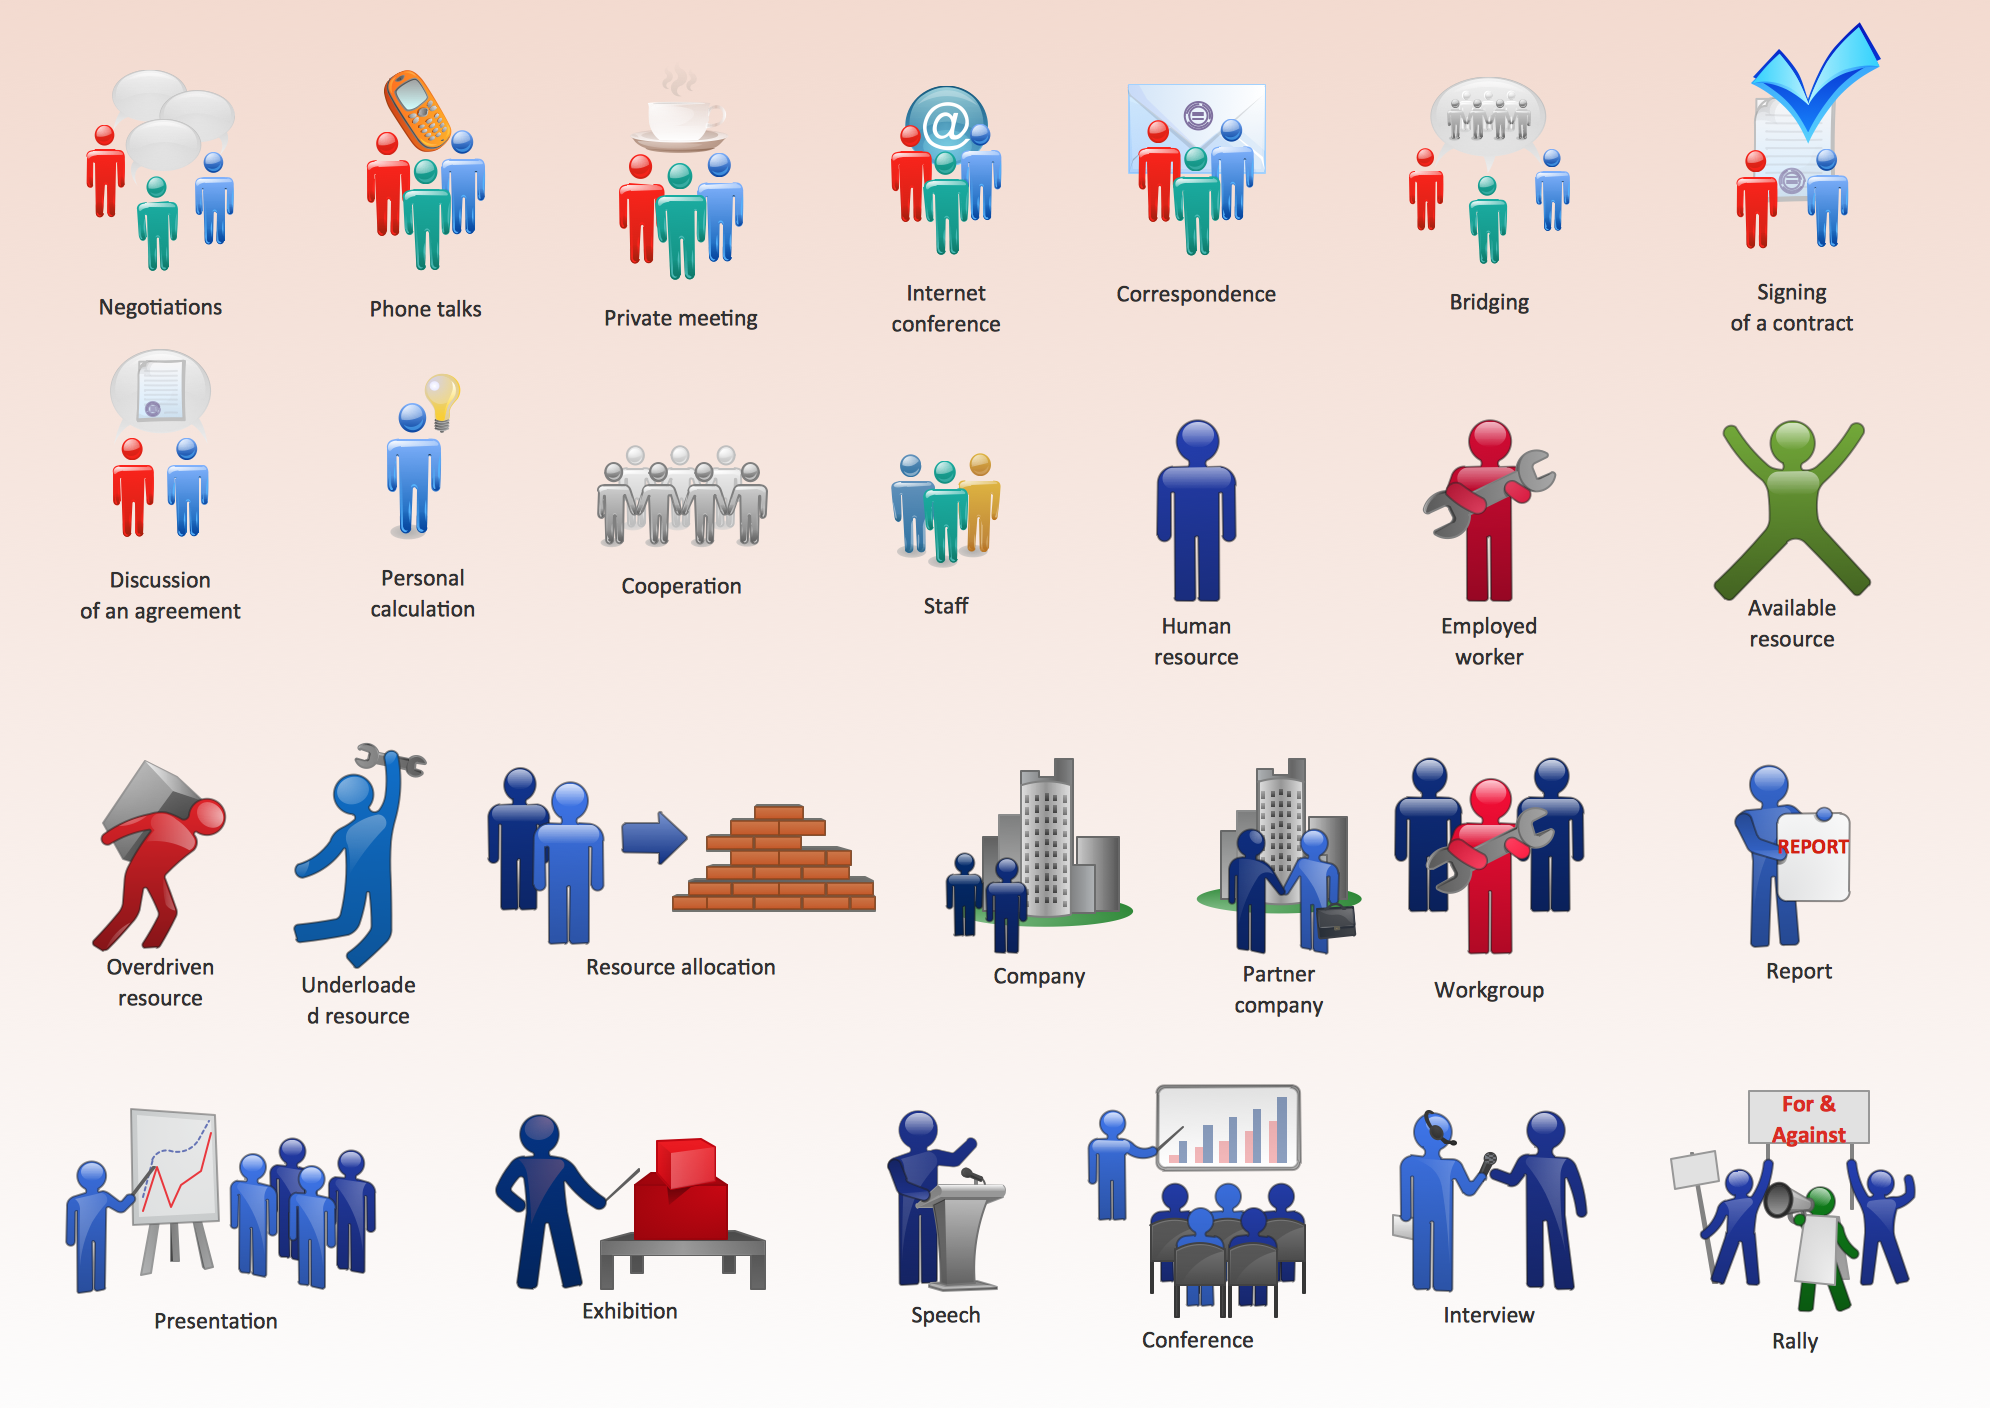
Business People Figures
PDPC

Biology Symbols
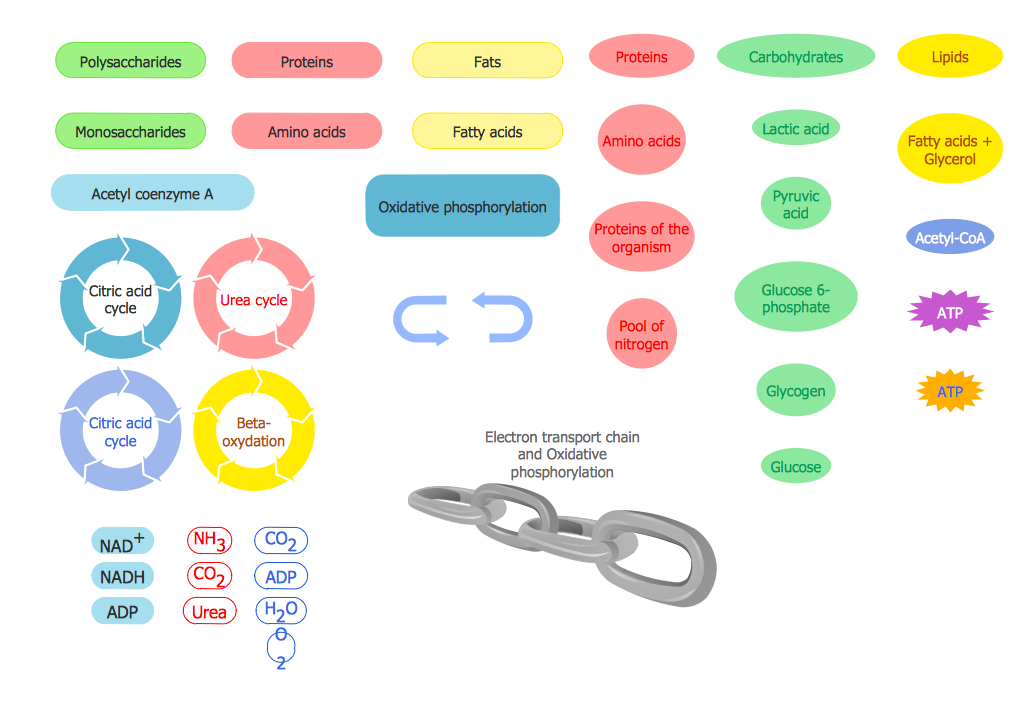
Biology solution provides 3 libraries with large quantity of vector biology symbols: Biochemistry of Metabolism Library, Carbohydrate Metabolism Library, Citric Acid Cycle (TCA Cycle) Library.
Cause and Effect Fishbone Diagram

Prioritization Matrix

How to Design Landscape

Pyramid Diagram and Pyramid Chart

How To Create Onion Diagram

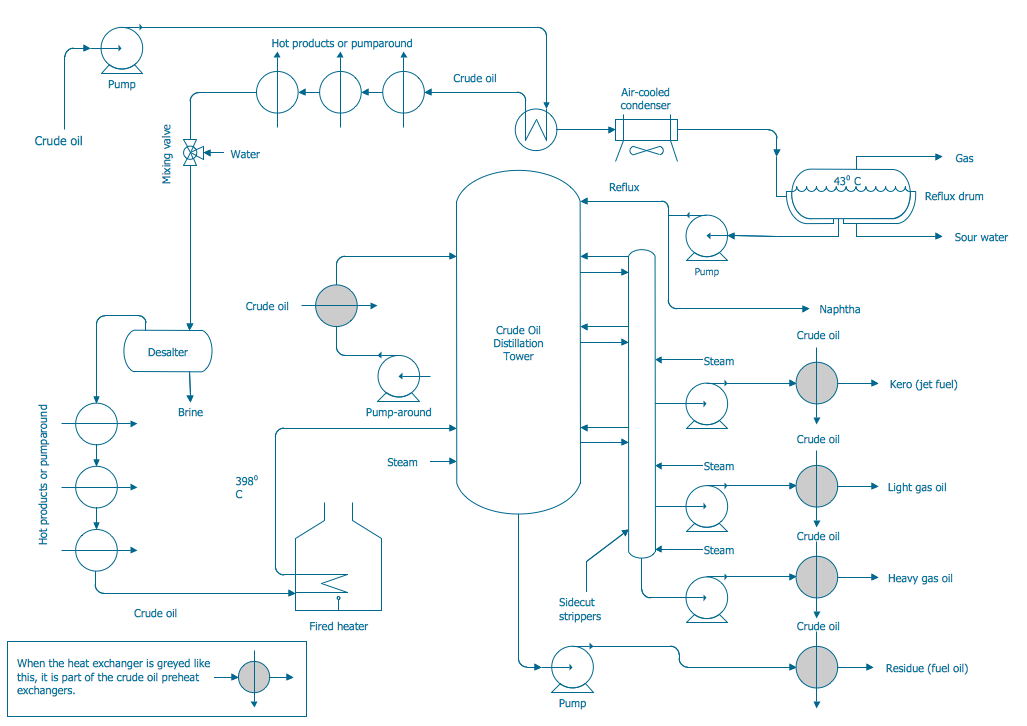
Process and Instrumentation Diagram
Workflow Diagram

How to Draw Business Process Diagrams with RapidDraw Interface

Scientific Symbols Chart

Mathematics Solution from the Science and Education area of ConceptDraw Solution Park includes a few shape libraries of plane, solid geometric figures, trigonometrical functions and greek letters to help you create different professional looking mathematic illustrations for science and education.
- Affinity Diagram Software | ConceptDraw Solution Park | Design ...
- Affinity diagram - Business expansion | Affinity Diagram ...
- Affinity Diagram
- How To Do A Mind Map In PowerPoint | Affinity Diagram | How to ...
- EPC for Business Process Improvement | Process Improvement ...
- EPC for Business Process Improvement | Affinity diagram ...
- Affinity Diagram | Process Flowchart | Seven Management and ...
- Affinity diagram - Business expansion | BPR Diagram. Business ...
- Affinity diagram - Business expansion | Affinity Diagram | Seven ...
- Affinity Diagram | Qualitative Risk Assessment Template
- Fishbone diagram - Causes of low-quality output | Design elements ...
- Affinity Diagram | How to Create Organizational Chart Quickly | How ...
- Activity Network Diagram Method
- Affinity Diagram | Cross-Functional Flowchart | Amazon Web ...
- Affinity Diagram | PROBLEM ANALYSIS. Root Cause Analysis Tree ...
- Workflow diagram - Weather forecast | Affinity diagram - Business ...
- Affinity Diagram | Accounting Information Systems Flowchart ...
- Target and Circular Diagrams | Affinity diagram - Business ...
- Process Flowchart | Affinity Diagram | How to Draw a Line Chart ...