"An economic expansion is an increase in the level of economic activity, and of the goods and services available. It is a period of economic growth as measured by a rise in real GDP. The explanation of such fluctuations in aggregate economic activity is one of the primary concerns of macroeconomics.
Typically an economic expansion is marked by an upturn in production and utilization of resources. Economic recovery and prosperity are two successive phases of expansion. It may be caused by factors external to the economy, such as weather conditions or technical change, or by factors internal to the economy, such as fiscal policies, monetary policies, the availability of credit, interest rates, regulatory policies or other impacts on producer incentives. Global conditions may influence the levels of economic activity in various countries." [Economic expansion. Wikipedia]
"The term business cycle (or economic cycle or boom-bust cycle) refers to economy-wide fluctuations in production, trade and economic activity in general over several months or years in an economy organized on free-enterprise principles.
The business cycle is the upward and downward movements of levels of GDP (gross domestic product) and refers to the period of expansions and contractions in the level of economic activities (business fluctuations) around its long-term growth trend.
These fluctuations occur around a long-term growth trend, and typically involve shifts over time between periods of relatively rapid economic growth (an expansion or boom), and periods of relative stagnation or decline (a contraction or recession)." [Business cycle. Wikipedia]
The affinity diagram example "Business expansion" was created using the ConceptDraw PRO diagramming and vector drawing software extended with the solution "Seven Management and Planning Tools" from the Management area of ConceptDraw Solution Park.
Affinity diagram
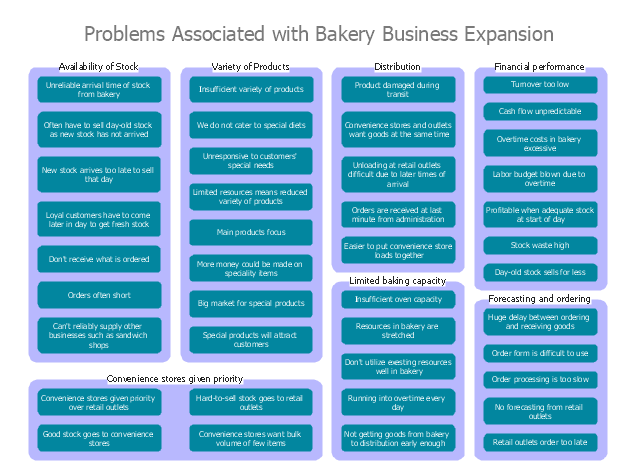
Affinity Diagram

The vector clipart library "Presentation design elements" contains 45 presentation symbols and arrows which you can easy use in your slides and illustrations.
"A presentation is the process of presenting a topic to an audience. It is typically a demonstration, lecture, or speech meant to inform, persuade, or build good will. ... the use of visuals reduced meeting times... audiences believe presenters who use visuals are more professional and credible than presenters who merely speak. ... meetings and presentations reinforced with visuals help participants reach decisions and consensus more quickly." [Presentation. Wikipedia]
The clip art example "Presentation design elements - Vector clipart library" was created in the ConceptDraw PRO diagramming and vector drawing software using the Presentation Clipart solution from the Illustration area of ConceptDraw Solution Park.
Advance Direction Sign

Circuit

Growth

Master Link

Comparison

Plus

Minus

Multiplication

Division

Loupe

Plus sign

Minus sign

Pros and Cons

Balance Lever

Balance

Scientific Research

Business People

Hand

Financial Growth

Wallet

Increase

Decrease

Clock

Mechanism

Interaction

Small Company

Big Company

Company Expansion

Foreign Market Entry

Time

Close Cooperation

Company

Company Merger

Company Extension

Foreign Market Penetration

Business Relations

Profits

Frame 1

Frame 2

Background 1

Background 2

Background 3

Background 4

Background 5

Title block

Expand collaboration capabilities with ConceptDraw DIAGRAM
Fishbone Diagram Example

The vector clipart library "Presentation design elements" contains 45 presentation symbols and arrows which you can easy use in your slides and illustrations.
"A presentation is the process of presenting a topic to an audience. It is typically a demonstration, lecture, or speech meant to inform, persuade, or build good will. ... the use of visuals reduced meeting times... audiences believe presenters who use visuals are more professional and credible than presenters who merely speak. ... meetings and presentations reinforced with visuals help participants reach decisions and consensus more quickly." [Presentation. Wikipedia]
The clip art example "Presentation design elements - Vector clipart library" was created in the ConceptDraw PRO diagramming and vector drawing software using the Presentation Clipart solution from the Illustration area of ConceptDraw Solution Park.
"A presentation is the process of presenting a topic to an audience. It is typically a demonstration, lecture, or speech meant to inform, persuade, or build good will. ... the use of visuals reduced meeting times... audiences believe presenters who use visuals are more professional and credible than presenters who merely speak. ... meetings and presentations reinforced with visuals help participants reach decisions and consensus more quickly." [Presentation. Wikipedia]
The clip art example "Presentation design elements - Vector clipart library" was created in the ConceptDraw PRO diagramming and vector drawing software using the Presentation Clipart solution from the Illustration area of ConceptDraw Solution Park.
Advance Direction Sign
Circuit
Growth
Master Link
Comparison
Plus
Minus
Multiplication
Division
Loupe
Plus sign
Minus sign
Pros and Cons
Balance Lever
Balance
Scientific Research
Business People
Hand
Financial Growth
Wallet
Increase
Decrease
Clock
Mechanism
Interaction
Small Company
Big Company
Company Expansion
Foreign Market Entry
Time
Close Cooperation
Company
Company Merger
Company Extension
Foreign Market Penetration
Business Relations
Profits
Frame 1
Frame 2
Background 1
Background 2
Background 3
Background 4
Background 5
Title block
UML Activity Diagram. Design Elements


Basic Diagramming


The vector stencils library "Progressive disclosure controls" contains 12 icons of Windows 8 progressive disclosure controls.
Use it to design graphic user interface (GUI) prototypes of your software applications for Windows 8.
"With a progressive disclosure control, users can show or hide additional information including data, options, or commands. Progressive disclosure promotes simplicity by focusing on the essential, yet revealing additional detail as needed. ...
Chevrons show or hide the remaining items in completely or partially hidden content. Usually the items are shown in place, but they can also be shown in a pop-up menu. When in place, the item stays expanded until the user collapses it. ...
Arrows show a pop-up command menu. The item stays expanded until the user makes a selection or clicks anywhere.
If the arrow button is an independent control, it receives input focus and is activated with the space bar. If the arrow button has a parent control, the parent receives input focus and the arrow is activated with Alt+down arrow and Alt+up arrow keys, as with the drop-down list control. ...
Plus and minus controls expand or collapse to show container content in place when navigating through a hierarchy. The item stays expanded until the user collapses it. Although these look like buttons, their behavior is in-place.
The associated object receives input focus. The plus is activated with the right arrow key, and the minus with the left arrow key. ...
Rotating triangles show or hide additional information in place for an individual item. They are also used to expand containers. The item stays expanded until the user collapses it.
The associated object receives input focus. The collapsed (right-pointing) triangle is activated with the right arrow key, and the expanded (downward-pointing) triangle with the left arrow key. ...
Like chevrons, additional information is shown or hidden in place. The item stays expanded until the user collapses it. Unlike chevrons, the glyphs have a graphical representation of the action, typically with an arrow indicating what will happen. ... Preview arrows are best reserved for situations where a standard chevron doesn't adequately communicate the control's behavior, such as when the disclosure is complex or there is more than one type of disclosure." [msdn.microsoft.com/ en-us/ library/ windows/ desktop/ dn742409%28v=vs.85%29.aspx]
The icons example "Progressive disclosure controls - Vector stencils library" was created using the ConceptDraw PRO diagramming and vector drawing software extended with the Windows 8 User Interface solution from the Software Development area of ConceptDraw Solution Park.
Single chevron control - down
Single chevron control - up
Double chevron control - back
Double chevron control - forward
Arrow control button - down
Arrow control button - right
Arrow control - down
Arrow control - right
Plus control

Minus control

Rotating triangle - expand

Rotating triangle - collapse

Process Flow Chart

 Business Process Diagrams
Business Process Diagrams solution extends the ConceptDraw DIAGRAM BPM software with RapidDraw interface, templates, samples and numerous libraries based on the BPMN 1.2 and BPMN 2.0 standards, which give you the possibility to visualize equally easy simple and complex processes, to design business models, to quickly develop and document in details any business processes on the stages of project’s planning and implementation.
Mechanical Engineering
Is ConceptDraw DIAGRAM an Alternative to Microsoft Visio?

HelpDesk
How to Resize Objects
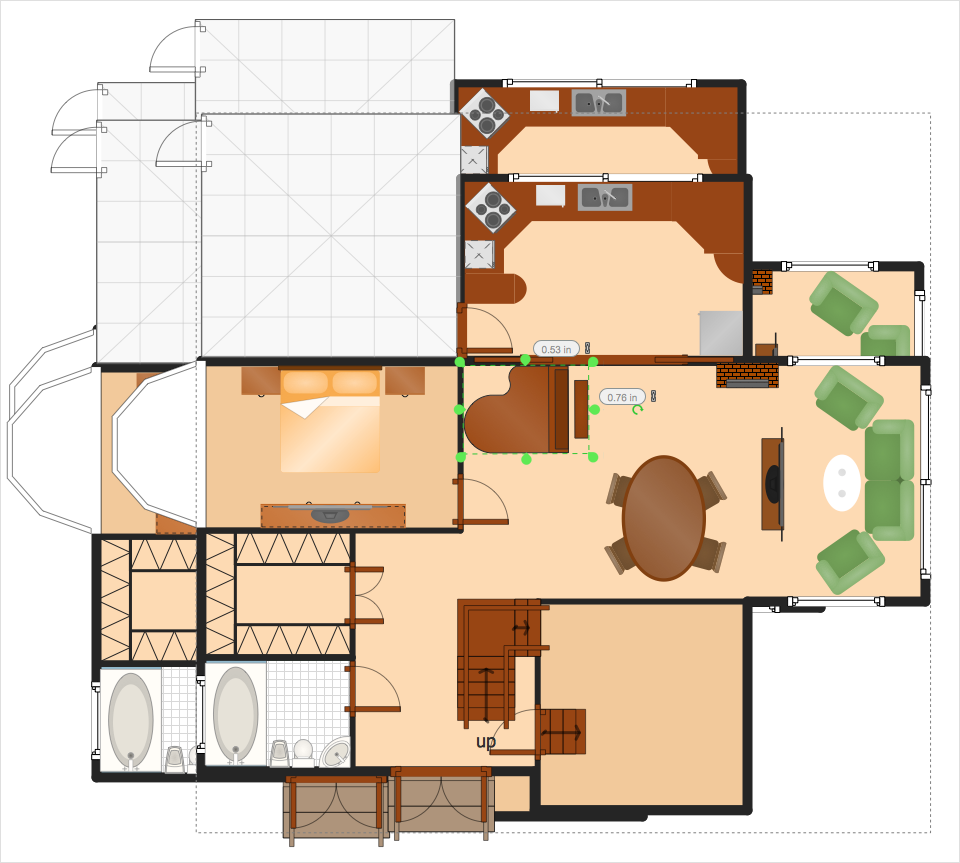
Home Electrical Plan

- Affinity diagram - Business expansion | BPR Diagram. Business ...
- Affinity diagram - Business expansion | Affinity Diagram | Seven ...
- Affinity diagram - Business expansion | BPM life cycle | Pyramid ...
- Target and Circular Diagrams | Affinity diagram - Business ...
- Example Of Affinity Diagram Business Requirements
- Workflow diagram - Weather forecast | Affinity diagram - Business ...
- Affinity Diagram | Affinity diagram - Implementing continuous ...
- Presentation design elements - Vector clipart library | Presentation ...
- Seven Management and Planning Tools | Affinity diagram ...
- Presentation design elements - Vector clipart library | Presentation ...
- Affinity Diagram | Affinity Diagram Software | How To Create an ...
- Workflow diagram - Weather forecast | How can you illustrate the ...
- Virtuous circle (macroeconomics) - Crystal diagram | Vicious circle ...
- Presentation design elements - Vector clipart library | Design ...
- Presentation Clipart | Presentation design elements - Vector clipart ...
- Seven Management and Planning Tools | Affinity diagram template ...
- Business Process Flow Chart Expanding Marketig Training
- How To Create an Affinity Diagram Using ConceptDraw Office ...
- Transport - Template | Business People Clipart | Business People ...
- Presentation design elements - Vector clipart library | Presentation ...