"An economic expansion is an increase in the level of economic activity, and of the goods and services available. It is a period of economic growth as measured by a rise in real GDP. The explanation of such fluctuations in aggregate economic activity is one of the primary concerns of macroeconomics.
Typically an economic expansion is marked by an upturn in production and utilization of resources. Economic recovery and prosperity are two successive phases of expansion. It may be caused by factors external to the economy, such as weather conditions or technical change, or by factors internal to the economy, such as fiscal policies, monetary policies, the availability of credit, interest rates, regulatory policies or other impacts on producer incentives. Global conditions may influence the levels of economic activity in various countries." [Economic expansion. Wikipedia]
"The term business cycle (or economic cycle or boom-bust cycle) refers to economy-wide fluctuations in production, trade and economic activity in general over several months or years in an economy organized on free-enterprise principles.
The business cycle is the upward and downward movements of levels of GDP (gross domestic product) and refers to the period of expansions and contractions in the level of economic activities (business fluctuations) around its long-term growth trend.
These fluctuations occur around a long-term growth trend, and typically involve shifts over time between periods of relatively rapid economic growth (an expansion or boom), and periods of relative stagnation or decline (a contraction or recession)." [Business cycle. Wikipedia]
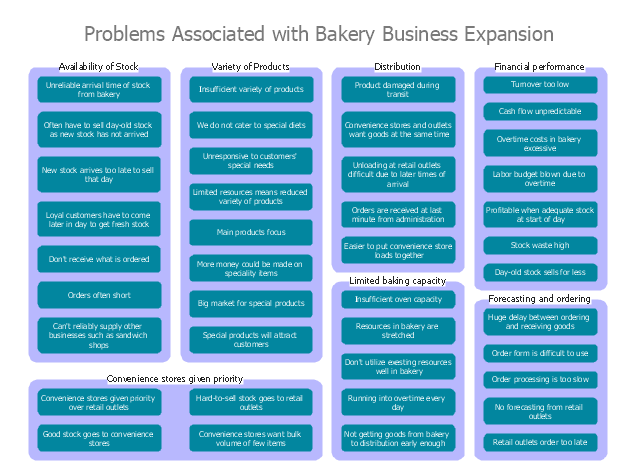
The affinity diagram example "Business expansion" was created using the ConceptDraw PRO diagramming and vector drawing software extended with the solution "Seven Management and Planning Tools" from the Management area of ConceptDraw Solution Park.
Typically an economic expansion is marked by an upturn in production and utilization of resources. Economic recovery and prosperity are two successive phases of expansion. It may be caused by factors external to the economy, such as weather conditions or technical change, or by factors internal to the economy, such as fiscal policies, monetary policies, the availability of credit, interest rates, regulatory policies or other impacts on producer incentives. Global conditions may influence the levels of economic activity in various countries." [Economic expansion. Wikipedia]
"The term business cycle (or economic cycle or boom-bust cycle) refers to economy-wide fluctuations in production, trade and economic activity in general over several months or years in an economy organized on free-enterprise principles.
The business cycle is the upward and downward movements of levels of GDP (gross domestic product) and refers to the period of expansions and contractions in the level of economic activities (business fluctuations) around its long-term growth trend.
These fluctuations occur around a long-term growth trend, and typically involve shifts over time between periods of relatively rapid economic growth (an expansion or boom), and periods of relative stagnation or decline (a contraction or recession)." [Business cycle. Wikipedia]
The affinity diagram example "Business expansion" was created using the ConceptDraw PRO diagramming and vector drawing software extended with the solution "Seven Management and Planning Tools" from the Management area of ConceptDraw Solution Park.
Affinity diagram
This circular arrows diagram sample shows business process management life cycle.
It was designed on the base of the Wikimedia Commons file: Business Process Management Life-Cycle.svg. [commons.wikimedia.org/ wiki/ File:Business_ Process_ Management_ Life-Cycle.svg]
This file is licensed under the Creative Commons Attribution-Share Alike 3.0 Unported license. [creativecommons.org/ licenses/ by-sa/ 3.0/ deed.en]
"BPM life-cycle.
Business process management activities can be grouped into six categories: vision, design, modeling, execution, monitoring, and optimization.
Functions are designed around the strategic vision and goals of an organization. Each function is attached with a list of processes. Each functional head in an organization is responsible for certain sets of processes made up of tasks which are to be executed and reported as planned. Multiple processes are aggregated to function accomplishments and multiple functions are aggregated to achieve organizational goals." [Business process management. Wikipedia]
The arrow donut chart example "BPM life cycle" was created using the ConceptDraw PRO diagramming and vector drawing software extended with the Circular Arrows Diagrams solution from the area "What is a Diagram" of ConceptDraw Solution Park.
Circular arrows diagram

This circular arrows diagram sample depicts the Plan–Do–Check–Act cycle.
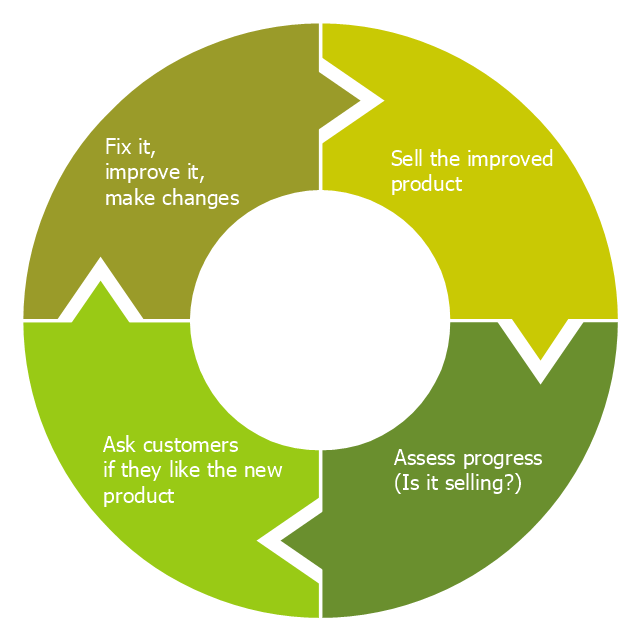
"PDCA (plan–do–check–act or plan–do–check–adjust) is an iterative four-step management method used in business for the control and continuous improvement of processes and products. It is also known as the Deming circle/ cycle/ wheel, Shewhart cycle, control circle/ cycle, or plan–do–study–act (PDSA). Another version of this PDCA cycle is OPDCA. The added "O" stands for observation or as some versions say "Grasp the current condition." This emphasis on observation and current condition has currency with Lean manufacturing/ Toyota Production System literature." [PDCA. Wikipedia]
The diagram example "PDCA cycle" was created using the ConceptDraw PRO diagramming and vector drawing software extended with the Circular Arrows Diagrams solution from the area "What is a Diagram" of ConceptDraw Solution Park.
Circular arrows diagram

"Feedback is a process in which information about the past or the present influences the same phenomenon in the present or future. As part of a chain of cause-and-effect that forms a circuit or loop, the event is said to "feed back" into itself. ...
Feedback loop - the complete causal path that leads from the initial detection of the gap to the subsequent modification of the gap. ...
Feedback is commonly divided into two types - usually termed positive and negative. The terms can be applied in two contexts:
(1) the altering of the gap between reference and actual values of a parameter, based on whether the gap is widening (positive) or narrowing (negative),
(2) the valence of the action or effect that alters the gap, based on whether it has a happy (positive) or unhappy (negative) emotional connotation to the recipient or observer." [Feedback. Wikipedia]
This cycle diagram example was redesigned from the Wikimedia Commons file: Business Feedback Loop.jpg. [commons.wikimedia.org/ wiki/ File:Business_ Feedback_ Loop.jpg]
This file is made available under the Creative Commons CC0 1.0 Universal Public Domain Dedication. [creativecommons.org/ publicdomain/ zero/ 1.0/ deed.en]
The ring chart example "Business feedback loop" was created using the ConceptDraw PRO diagramming and vector drawing software extended with the Target and Circular Diagrams solution from the Marketing area of ConceptDraw Solution Park.
www.conceptdraw.com/ solution-park/ marketing-target-and-circular-diagrams
Ring chart
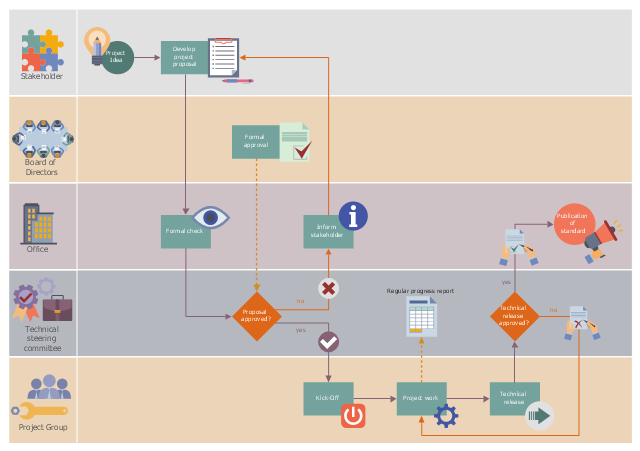
This workflow diagram example was designed on the base of the Wikimedia Commons file: ASAM e.V. flowchart.png.
"Life cycle of an ASAM standard." [commons.wikimedia.org/ wiki/ File:ASAM_ e.V._ flowchart.png]
This file is licensed under the Creative Commons Attribution-Share Alike 3.0 Unported license. [creativecommons.org/ licenses/ by-sa/ 3.0/ deed.en]
"Association for Standardization of Automation and Measuring Systems or ASAM is an incorporated association under German law. Its members are primarily international car manufacturers, suppliers and engineering service providers from the automotive industry. The association coordinates the development of technical standards, which are developed by working groups composed of experts from its member companies. ASAM pursues the vision that the tools of a development process chain can be freely interconnected and allow a seamless exchange of data. The standards define protocols, data models, file formats and application programming interfaces (APIs) for the use in the development and testing of automotive electronic control units." [Association for Standardisation of Automation and Measuring Systems. Wikipedia]
The workflow diagram example "Life cycle of an ASAM standard" was created using ConceptDraw PRO software extended with the Business Process Workflow Diagrams solution from the Business Processes area of ConceptDraw Solution Park.
Workflow diagram
This cycle process chart was redesigned from the Wikimedia Commons file: Business Feedback Loop PNG version.png.
"A business ideally is continually seeking feedback from customers: are the products helpful? are their needs being met? Constructive criticism helps marketers adjust offerings to meet customer needs."
[commons.wikimedia.org/ wiki/ File:Business_ Feedback_ Loop_ PNG_ version.png]
The cycle process diagram example "Business feedback loop" was created using the ConceptDraw PRO diagramming and vector drawing software extended with the Sales Flowcharts solution from the Marketing area of ConceptDraw Solution Park.
Customers feedback cycle process chart

- Business Cycle Diagram
- Business Cycle Circular Diagram
- Affinity diagram - Business expansion | BPR Diagram . Business ...
- Virtuous circle (macroeconomics) - Crystal diagram | Vicious circle ...
- How can you illustrate the weather condition | Affinity diagram ...
- Seven Management and Planning Tools | Affinity diagram ...
- Example Of Affinity Diagram Business Requirements
- Affinity Diagram | How To Create an Affinity Diagram Using ...
- Affinity diagram - Business expansion | Affinity Diagram | Seven ...
- Affinity Diagram | Affinity diagram - Implementing continuous ...
- Seven Management and Planning Tools | Affinity diagram template ...
- Affinity Diagram | Affinity Diagram Software | Affinity diagram ...
- Circular arrows diagram - BPM life cycle
- Business Process Modeling Software for Mac | BPM Software ...
- Affinity Diagram | Affinity Diagram Software | How To Create an ...
- Business Process Management | Business Process Reengineering ...
- Workflow diagram - Weather forecast | How can you illustrate the ...
- Business feedback loop - Ring chart
- Cycle Process Diagram
- Circular Diagrams Business