 Business Process Diagrams
The Business Process Diagram Solution extends ConceptDraw PRO v10 BPMN software with its RapidDraw interface, templates, samples, and libraries based on the BPMN 1.2 and BPMN 2.0 standards. This powerful solution permits you to visualize easily both simple and complex processes, as well as design business models. The Business Process Diagram solution allows one to quickly develop and document in detail any business processes at any stage of a project’s planning and implementation.
Affinity Diagram
The affinity diagram is a business tool used to organize ideas and data. It is one of the Seven Management and Planning Tools. But how design the Affinity Diagram quick and easy? ConceptDraw PRO diagramming and vector drawing software offers the Seven Management and Planning Tools Solution from the Management Area.
 Business Processes Area
Solutions of Business Processes area extend ConceptDraw PRO software with samples, templates and vector stencils libraries for drawing business process diagrams and flowcharts for business process management.
 Circular Arrows Diagrams
Circular Arrows Diagrams solution extends ConceptDraw PRO v10 with extensive drawing tools, predesigned samples, Circular flow diagram template for quick start, and a library of ready circular arrow vector stencils for drawing Circular Arrow Diagrams, Segmented Cycle Diagrams, and Circular Flow Diagrams. The elements in this solution help managers, analysts, business advisers, marketing experts, scientists, lecturers, and other knowledge workers in their daily work.
 IDEF Business Process Diagrams
Use the IDEF Business Process Diagrams solution to create effective database designs and object-oriented designs, following the integration definition methodology.
 Flowcharts
The Flowcharts Solution for ConceptDraw PRO v10 is a comprehensive set of examples and samples in several different color themes for professionals that need to graphically represent a process. Solution value is added by basic flow chart template and shapes' library of Flowchart notation. ConceptDraw PRO flow chart creator lets one depict a processes of any complexity and length, as well design of the flowchart either vertically or horizontally.
Stakeholder Onion Diagram Template
For depicting the onion model are actively used Stakeholder Onion Diagrams. The ConceptDraw PRO diagramming and vector drawing software extended with Stakeholder Onion Diagrams Solution from the Management Area of ConceptDraw Solution Park offers the number of useful tools and Stakeholder Onion Diagram template for their easy design.HelpDesk
How to Draw a Mind Map on PC Using ConceptDraw MINDMAP
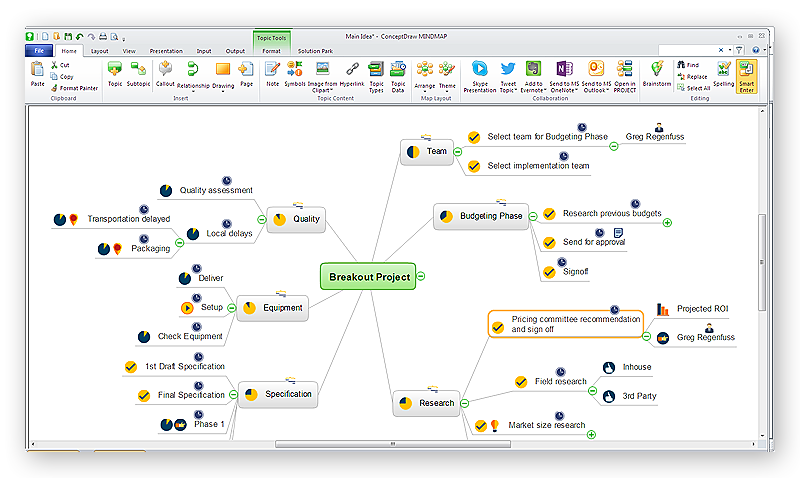
Mind maps are useful forcapturing ideas, organizing and structuring information in a visual form, that is easier to understand, and easier to explain to others. Mind map consists of a general Main Idea surrounded by other related topics and subtopics, which are displayed in a radial hierarchical structure. Read this step-by-step guide on how to create a mind map using ConceptDraw MINDMAP for Windows.
 Seven Management and Planning Tools
Seven Management and Planning Tools solution extends ConceptDraw PRO and ConceptDraw MINDMAP with features, templates, samples and libraries of vector stencils for drawing management mind maps and diagrams.
CORRECTIVE ACTIONS PLANNING. PERT Chart
The PERT Chart is constructed as part of the process in creating a schedule of corrective actions. The PERT Chart shows the logical connections and consequence of tasks to be performed. It displays the time period for problem solving and the implementation of all activities through the critical path. ConceptDraw Office suite is a software for corrective actions planning.
 Basic Venn Diagrams
This solution extends ConceptDraw PRO v10 (or later) with samples, templates, and libraries of vector stencils for drawing Venn Diagrams.
 Venn Diagrams
Venn Diagrams are actively used to illustrate simple set relationships in set theory and probability theory, logic and statistics, mathematics and computer science, linguistics, sociology, and marketing. Venn Diagrams are also often used to visually summarize the status and future viability of a project.
- BPR Diagram . Business Process Reengineering Example | Strategic ...
- Affinity diagram - Business expansion | BPM life cycle | Pyramid ...
- Social media activity of a real estate agent | Work Order Process ...
- Process Flowchart | Structured Systems Analysis and Design ...
- SWOT Analysis Solution - Strategy Tools | Pyramid Chart Examples ...
- Pyramid Diagram | Pyramid Chart Examples | Cross-Functional ...
- Marketing Plan Infographic | Market Chart | Pyramid Diagram and ...
- Service-goods continuum diagram | Process Flowchart | How To ...
- Business Process Management Wiki
- School and Training Plans | Classroom Layout | Classroom Seating ...
- Business Process Management | How to Create Management ...
- Emergency Plan | Process Flowchart | Office Layout | Free Pricing ...
- SWOT Analysis Solution - Strategy Tools | SWOT analysis matrix ...
- Collaboration in a Project Team | Expand collaboration capabilities ...
- Business Processes
- HR management process - Flowchart | Sales Process Flowchart ...
- How to Create SWOT Analysis Template Using ConceptDraw PRO ...
- Process Flowchart | BPR Diagram. Business Process ...
- Block diagram - Six markets model | Functional Flow Block Diagram ...
- SWOT Matrix Template | SWOT Sample in Computers | Marketing ...


